Figure 3.5(d) shows sample proportions from samples of size n = 180 from a population. Figure 3.5
Question:
Figure 3.5
d.
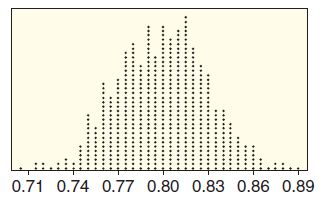
Refer to the sampling distributions given in Figure 3.5. In each case, estimate the value of the population parameter and estimate the standard error for the sample statistic.
Transcribed Image Text:
0.71 0.74 0.77 0.80 0.83 0.86 0.89
Fantastic news! We've Found the answer you've been seeking!
Step by Step Answer:
Answer rating: 70% (10 reviews)
We expect the sampling distribution to be centered at the value of the popu...View the full answer
Answered By
Akshay Singla
as a qualified engineering expert i am able to offer you my extensive knowledge with real solutions in regards to planning and practices in this field. i am able to assist you from the beginning of your projects, quizzes, exams, reports, etc. i provide detailed and accurate solutions.
i have solved many difficult problems and their results are extremely good and satisfactory.
i am an expert who can provide assistance in task of all topics from basic level to advance research level. i am working as a part time lecturer at university level in renowned institute. i usually design the coursework in my specified topics. i have an experience of more than 5 years in research.
i have been awarded with the state awards in doing research in the fields of science and technology.
recently i have built the prototype of a plane which is carefully made after analyzing all the laws and principles involved in flying and its function.
1. bachelor of technology in mechanical engineering from indian institute of technology (iit)
2. award of excellence in completing course in autocad, engineering drawing, report writing, etc
4.70+
48+ Reviews
56+ Question Solved
Related Book For
Statistics Unlocking The Power Of Data
ISBN: 9780470601877
1st Edition
Authors: Robin H. Lock, Patti Frazer Lock, Kari Lock Morgan, Eric F. Lock, Dennis F. Lock
Question Posted:
Students also viewed these Mathematics questions
-
Figure 3.5(a) shows sample proportions from samples of size n = 40 from a population. Figure 3.5a. Refer to the sampling distributions given in Figure 3.5. In each case, estimate the value of the...
-
Using the sampling distribution shown in Figure 3.5(b), how likely are these sample means: Figure 3.5 b. (a) xÌ = 70 (b) xÌ = 100 (c) xÌ = 140 Refer to the sampling distributions...
-
Using the sampling distribution shown in Figure 3.5(c), how likely are these sample means: Figure 3.5 c. (a) xÌ = 250 (b) xÌ = 305 (c) xÌ = 315 Refer to the sampling...
-
Your home business uses 570 square feet of your 2,850 square foot home. If household expenses for the year were $28,558, how much was alloted to your business? Amount invested
-
A local partnership is liquidating and is currently reporting the following capital balances: Barley, capital (50% share of all profits and losses) . . . ...... $ 44,000 Carter, capital (30%) . . . ....
-
A novel process has been proposed to create a composite palladium tube for use as a hydrogen separation membrane in order to produce high-purity hydrogen. To fabricate the composite palladium tube, a...
-
What set of eco-efficiency characteristics is the shareholder value approach concerned with identifying?
-
Compute the multifactor productivity measure for each of the weeks shown for production of chocolate bars. What do the productivity figures suggest? Assume 40-hour weeks and an hourly wage of $ 12....
-
Company sold a flight equipment for $15 million cash at the end of its 17th year of use. The flight equipment originally cost $75.5 million and was depreciated using the straight-line method with...
-
Instaleaf, a Canadian clothing merchandiser, made a contract with Raston Clothing of Hong Kong whereby Instaleaf would import jackets from Raston and pay them by letter of credit. The letter of...
-
Using the sampling distribution shown in Figure 3.5(a), how likely are these sample proportions: Figure 3.5 a. (a) pÌ = 0.1 (b) pÌ = 0.35 (c) pÌ = 0.6 Refer to the sampling...
-
Figure 3.5(c) shows sample means from samples of size n = 100 from a population. Figure 3.5c. Refer to the sampling distributions given in Figure 3.5. In each case, estimate the value of the...
-
What test can be used to compare the mean wing length in the four groups? Ornithology Data are available from four source populations of stonechat birds: (1) An African group that resides year-round...
-
Identify four major types of working papers.
-
Identify the owner(s) of a proprietorship, a partnership, and a corporation.
-
Describe and explain the operation of a phase-shift oscillator.
-
For each of the users of accounting information, indicate whether they are an external decision maker (E) or an internal decision maker (I). a. Marketing manager b. Canada Revenue Agency c. Investor...
-
Using recent news headlines, describe an example of teaming in which a group of people came together briefly to solve a complex problem.
-
In problem, solve each equation. e -2x = 1/3
-
The Dow Jones Industrial Average reached a high of $ 7801.63 on December 29, 1997. Recall from Example 18.4 that it reached a high of $ 1003 on November 14, 1972. The Consumer Price Index for...
-
Compute the mean change in cholesterol? Table 2.15: Serum-cholesterol levels (mg/dL) before and after adopting a vegetarian diet *Before after. Subject Before After Difference* 195 146 49 145 155 -10...
-
Compute the standard deviation of the change in cholesterol levels? Table 2.15: Serum-cholesterol levels (mg/dL) before and after adopting a vegetarian diet *Before after. Subject Before After...
-
Construct a stem-and-leaf plot of the cholesterol changes? Table 2.15: Serum-cholesterol levels (mg/dL) before and after adopting a vegetarian diet *Before after. Subject Before After Difference* 195...
-
What is the relationship between government and the economy, including economic policies, and intervention? Bagheri, M., Guevara, Z., Alikarami, M., Kennedy, C. A., & Doluweera, G. (2018). Green...
-
3.Taxpayer, who is in the highest federal tax bracket in the current year, has a $5,000 gain from a collectible and a $5,000 gain from stock, both held long-term. (a) What is Taxpayer's net capital...
-
Can you draw a graph to show me how I would depict a change in the Monocentric City Model due to an inflow on the shape of Northwern cities due to the mass migration of African-Americans from the...
Study smarter with the SolutionInn App