

Condensed balance sheet and income statement data for Kersenbrock Corporation appear below. Additional information: 1. The market
Question:
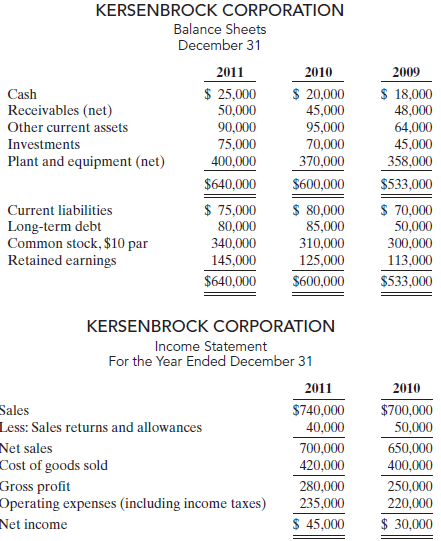
Condensed balance sheet and income statement data for Kersenbrock Corporation appear below.
Additional information:
1. The market price of Kersenbrock’s common stock was $4.00, $5.00, and $8.00 for 2009, 2010, and 2011, respectively.
2. All dividends were paid in cash.
Instructions
(a) Compute the following ratios for 2010 and 2011.
(1) Profit margin.
(2) Asset turnover.
(3) Earnings per share. (Weighted average common shares in 2011 were 32,000 and in 2010 were 31,000.)
(4) Price-earnings.
(5) Payout.
(6) Debt to total assets.
(b) Based on the ratios calculated, discuss briefly the improvement or lack thereof in financial position and operating results from 2010 to 2011 of Kersenbrock Corporation.
Step by Step Answer:
a b The underlying profitability of the corporation appears to have improved For example p...View the full answer


Accounting Principles
ISBN: 978-0470533475
9th Edition
Authors: Jerry J. Weygandt, Paul D. Kimmel, Donald E. Kieso
