

The following circle graph, which was created using Stat Crunch with data from the website www.healthline.com, shows
Question:
The following circle graph, which was created using Stat Crunch with data from the website www.healthline.com, shows the percentages of Americans with the various blood types.
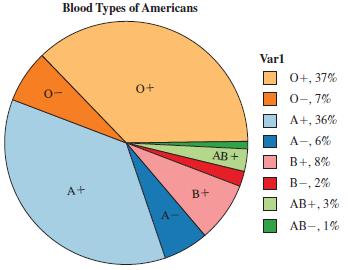
If one American is randomly selected, determine the odds in favor of the person having blood type B+.
Fantastic news! We've Found the answer you've been seeking!
Step by Step Answer:
The odds in ...View the full answer

Answered By
Jayshree Rathi
Hello Students!
This is Jayshree Rathi. I work on a number of renowned student-centric channels such as Chegg, coursehero, as a certified private tutor.
If you are looking for relevant and original content to complete your assignments, essays, and homework, then contact me and within the promised time, I will deliver you your personalized academic work and help you score the best.
1+ Reviews
10+ Question Solved
Related Book For 

A Survey Of Mathematics With Applications
ISBN: 9780135740460
11th Edition
Authors: Allen R. Angel, Christine D. Abbott, Dennis Runde
Question Posted:
