

The following graph was created using Stat Crunch with data from the website NPS.gov. The graph shows
Question:
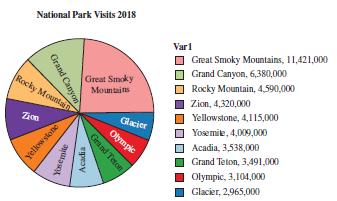
The following graph was created using Stat Crunch with data from the website NPS.gov. The graph shows the number of visits to the top 10 most visited national parks for the year 2018. The total number of visits to these 10 parks was 47,933,000 visits.
 If a park on this list is visited, determine the empirical probability that the park visited is
a) Great Smoky Mountains National Park.
b) A park other than Great Smoky Mountains National Park.
c) Yellowstone National Park.
d) A park other than Yellowstone National Park.
Write your answer as a decimal number rounded to four decimal places. In each exercise, assume the trend continues.
Fantastic news! We've Found the answer you've been seeking!
Step by Step Answer:
a b Pnot Great Smoky Mtns 1 02...View the full answer

Answered By
Muhammad Umair
I have done job as Embedded System Engineer for just four months but after it i have decided to open my own lab and to work on projects that i can launch my own product in market. I work on different softwares like Proteus, Mikroc to program Embedded Systems. My basic work is on Embedded Systems. I have skills in Autocad, Proteus, C++, C programming and i love to share these skills to other to enhance my knowledge too.
1+ Reviews
10+ Question Solved
Related Book For 

A Survey Of Mathematics With Applications
ISBN: 9780135740460
11th Edition
Authors: Allen R. Angel, Christine D. Abbott, Dennis Runde
Question Posted:
