

Graph the ranges of the samples in Prob. 6 on a control chart for ranges. Data from
Question:
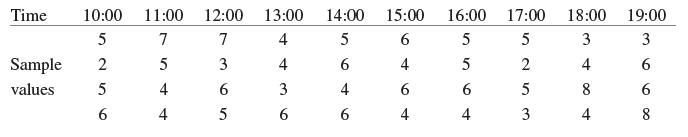
Graph the ranges of the samples in Prob. 6 on a control chart for ranges.
Data from Prob. 6
Graph the means of the following 10 samples (thickness of gaskets, coded values) on a control chart for means, assuming that the population is normal with mean 5 and standard deviation 1.16.
Fantastic news! We've Found the answer you've been seeking!
Step by Step Answer:
To create a control chart for ranges we need to first calculate the range of each sample The range i...View the full answer

Answered By
Brian Otieno
I'm Brian , an experienced professional freelancer with countless hours of success in freelancing many subjects in different disciplines. Specifically, I have handled many subjects and excelled in many disciplines. I have worked on many Computer Science projects and have been able to achieve a lot in that field. Additionally, I have handled other disciplines like History, Humanities, Social Sciences, Political science, Health care and life science, and Religion / Theology. My experience generally in these subjects has made me able to deliver high-quality projects in a very timely fashion. I am very reliable at my job and will get the work done in time, no matter what. In Addition, I have managed to ensure that the work meets my client's expectations and does not cause an error. I am a hard-working and diligent person who is highly responsible for everything I do. Generally, Freelancing has made me more accountable for doing my job. Additionally, I have had a passion for writing for the last seven years in this field.
0 Reviews
10+ Question Solved
Related Book For 

Question Posted:
