

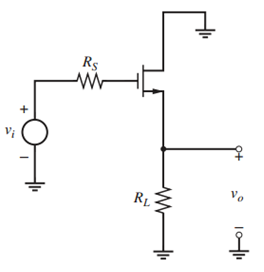
For the source follower in Fig. 7.13b, find the low-frequency gain and plot the magnitude and phase
Question:
Data from Prob. 7.2:
The following NMOS transistor data: NMOS: W = 100 µm, Ldrwn = 2 µm, Ld = 0.2 µm, Xd = 0, λ = 0, k€™n = 60 µA/V2, γ = 0, Csb = Cdb = 0, Cox = 0.7 fF/(µm2), and Cgd = 14 fF.
Fig. 7.13 b:
Fantastic news! We've Found the answer you've been seeking!
Step by Step Answer:
26 10 1...View the full answer

Answered By
Emel Khan
I have the ability to effectively communicate and demonstrate concepts to students. Through my practical application of the subject required, I am able to provide real-world examples and clarify complex ideas. This helps students to better understand and retain the information, leading to improved performance and confidence in their abilities. Additionally, my hands-on approach allows for interactive lessons and personalized instruction, catering to the individual needs and learning styles of each student.
2+ Reviews
10+ Question Solved
Related Book For 

Analysis and Design of Analog Integrated Circuits
ISBN: 978-0470245996
5th edition
Authors: Paul R. Gray, Paul J. Hurst Stephen H. Lewis, Robert G. Meyer
Question Posted:
