

A spreadsheet containing financial statements for Mens Wearhouse, Inc., for fiscal years 20062010 is available for download
Question:
A spreadsheet containing financial statements for Men’s Wearhouse, Inc., for fiscal years 2006–2010 is available for download from McGraw-Hill’s Connect or your course instructor.
| MEN'S WEARHOUSE INC. | ||||||
| BALANCE SHEET ($ millions) | ||||||
| 2006 | 2007 | 2008 | 2009 | 2010 | ||
| ASSETS | ||||||
| Cash & Short-Term Investments | 263.001 | 179.694 | 99.367 | 104.533 | 186.018 | |
| Net Receivables | 19.276 | 17.018 | 24.872 | 40.662 | 16.745 | |
| Inventories | 416.603 | 448.586 | 492.423 | 440.099 | 431.492 | |
| Prepaid Expenses | 0.000 | 0.000 | 27.179 | 26.603 | 0.000 | |
| Other Current Assets | 30.732 | 35.531 | 27.154 | 19.718 | 74.075 | |
| Total Current Assets | 729.612 | 680.829 | 670.995 | 631.615 | 708.330 | |
| Gross Plant, Property & Equipment | 611.957 | 669.340 | 865.084 | 885.981 | 866.005 | |
| Accumulated Depreciation | 342.371 | 379.700 | 454.917 | 498.509 | 521.259 | |
| Net Plant, Property & Equipment | 269.586 | 289.640 | 410.167 | 387.472 | 344.746 | |
| Intangibles | 63.073 | 61.765 | 75.609 | 65.268 | 59.414 | |
| Other Assets | 61.003 | 64.718 | 99.696 | 103.375 | 119.616 | |
| TOTAL ASSETS | 1,123.274 | 1,096.952 | 1,256.467 | 1,187.730 | 1,232.106 | |
| LIABILITIES | ||||||
| Long Term Debt Due In One Year | 0.000 | 0.000 | 0.000 | 0.000 | 0.000 | |
| Accounts Payable | 125.064 | 111.213 | 146.713 | 108.800 | 83.052 | |
| Taxes Payable | 21.086 | 19.676 | 5.590 | 0.019 | 23.936 | |
| Accrued Expenses | 72.531 | 75.458 | 70.222 | 66.542 | 0.000 | |
| Other Current Liabilities | 19.404 | 19.791 | 54.730 | 44.862 | 117.047 | |
| Total Current Liabilities | 238.085 | 226.138 | 277.255 | 220.223 | 224.035 | |
| Long Term Debt | 207.750 | 72.967 | 92.399 | 62.916 | 43.491 | |
| Deferred Taxes | 24.400 | 12.200 | 4.000 | 2.700 | 0.000 | |
| Other Liabilities | 25.506 | 31.875 | 66.876 | 59.743 | 62.236 | |
| TOTAL LIABILITIES | 495.741 | 343.180 | 440.530 | 345.582 | 329.762 | |
| EQUITY | ||||||
| Common Stock | 0.671 | 0.691 | 0.696 | 0.700 | 0.705 | |
| Capital Surplus | 255.214 | 286.120 | 305.209 | 315.404 | 327.742 | |
| Retained Earnings | 641.558 | 775.857 | 923.713 | 938.580 | 986.523 | |
| Less: Treasury Stock | 269.910 | 308.896 | 413.681 | 412.536 | 412.626 | |
| TOTAL EQUITY | 627.533 | 753.772 | 815.937 | 842.148 | 902.344 | |
| TOTAL LIABILITIES & EQUITY | 1,123.274 | 1,096.952 | 1,256.467 | 1,187.730 | 1,232.106 | |
| Common Shares Outstanding | 53.069 | 53.919 | 51.479 | 51.918 | 52.288 | |
| INCOME STATEMENT ($ millions, except per share) | ||||||
| 2006 | 2007 | 2008 | 2009 | 2010 | ||
| Sales | 1,724.898 | 1,882.064 | 2,112.558 | 1,972.418 | 1,909.575 | |
| Cost of Goods Sold | 965.889 | 1,004.972 | 1,062.205 | 1,031.241 | 1,025.759 | |
| Gross Profit | 759.009 | 877.092 | 1,050.353 | 941.177 | 883.816 | |
| Selling, General, & Administrative Exp. | 531.839 | 591.767 | 741.405 | 757.073 | 732.722 | |
| Operating Income Before Deprec. | 227.170 | 285.325 | 308.948 | 184.104 | 151.094 | |
| Depreciation, Depletion, & Amortization | 61.874 | 61.387 | 80.296 | 90.665 | 86.090 | |
| Operating Profit | 165.296 | 223.938 | 228.652 | 93.439 | 65.004 | |
| Interest Expense | 5.888 | 9.216 | 5.046 | 4.300 | 0.332 | |
| Non-Operating Income/Expense | 3.280 | 9.786 | 5.987 | 2.592 | 0.000 | |
| Special Items | 0.000 | 0.000 | 0.000 | (2.968) | 3.200 | |
| Pretax Income | 162.688 | 224.508 | 229.593 | 88.763 | 67.872 | |
| Total Income Taxes | 58.785 | 75.933 | 82.552 | 29.919 | 22.364 | |
| Income Before Extraordinary | ||||||
| Items & Discontinued Operations | 103.903 | 148.575 | 147.041 | 58.844 | 45.508 | |
| Savings Due to Common Stock Equiv. | 0.000 | 0.000 | 0.000 | 0.000 | (0.834) | |
| Adjusted Net Income | 103.903 | 148.575 | 147.041 | 58.844 | 44.674 | |
| EPS Basic from Operations | 2.010 | 2.710 | 2.760 | 1.180 | 0.820 | |
| EPS Diluted from Operations | 1.950 | 2.620 | 2.730 | 1.170 | 0.820 | |
| Dividends Per Share | 0.000 | 0.200 | 0.230 | 0.280 | 0.280 | |
| Com Shares for Basic EPS | 53.753 | 53.111 | 53.258 | 51.645 | 52.280 | |
| Com Shares for Diluted EPS | 55.365 | 54.749 | 53.890 | 51.944 | 52.280 | |
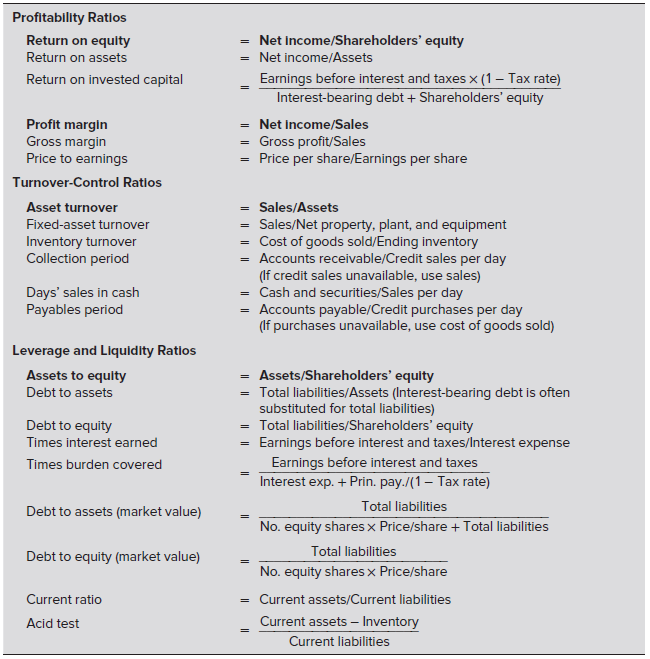
a. Use the spreadsheet to calculate as many of the company’s profitability, turnover-control, and leverage and liquidity ratios as you can for these years (see Table 2.4).
b. What do these ratios suggest about the company’s performance over this period? 15. To answer the
Table 2.4
Financial statements are the standardized formats to present the financial information related to a business or an organization for its users. Financial statements contain the historical information as well as current period’s financial... Common Stock
Common stock is an equity component that represents the worth of stock owned by the shareholders of the company. The common stock represents the par value of the shares outstanding at a balance sheet date. Public companies can trade their stocks on...
Fantastic news! We've Found the answer you've been seeking!
Step by Step Answer:
a 2006 2007 2008 2009 2010 Profitability Ratios Return on equity 166 197 180 70 50 Return on assets ...View the full answer

Answered By
Muhammad Umair
I have done job as Embedded System Engineer for just four months but after it i have decided to open my own lab and to work on projects that i can launch my own product in market. I work on different softwares like Proteus, Mikroc to program Embedded Systems. My basic work is on Embedded Systems. I have skills in Autocad, Proteus, C++, C programming and i love to share these skills to other to enhance my knowledge too.
1+ Reviews
10+ Question Solved
Related Book For 

Question Posted:
