

Each of the graphs in Figure 2.50 shows the position of a particle moving along the x-axis
Question:
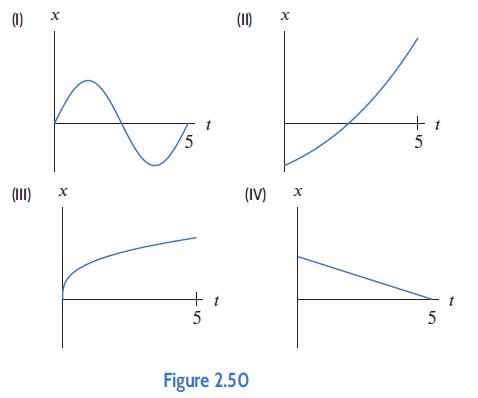
Each of the graphs in Figure 2.50 shows the position of a particle moving along the x-axis as a function of time, 0 ≤ t ≤ 5. The vertical scales of the graphs are the same. During this time interval, which particle has
(a) Constant velocity?
(b) The greatest initial velocity?
(c) The greatest average velocity?
(d) Zero average velocity?
(e) Zero acceleration?
(f) Positive acceleration throughout?
Fantastic news! We've Found the answer you've been seeking!
Step by Step Answer:
a IV ...View the full answer

Answered By
Poonam Chaudhary
I have 15 month+ Teaching Experience
2+ Reviews
10+ Question Solved
Related Book For 

Applied Calculus
ISBN: 9781119275565
6th Edition
Authors: Deborah Hughes Hallett, Patti Frazer Lock, Andrew M. Gleason, Daniel E. Flath, Sheldon P. Gordon, David O. Lomen, David Lovelock, William G. McCallum, Brad G. Osgood, Andrew Pasquale
Question Posted:
