

Figure 13 shows the price of 1 barrel of crude oil on the New York Stock Exchange
Question:
Figure 13 shows the price of 1 barrel of crude oil on the New York Stock Exchange from March 1, 2015, to March 1, 2016. Determine the price decrease from March 1, 2015, to January 1, 2016. Also determine whether the price was rising, falling, or holding steady on these days.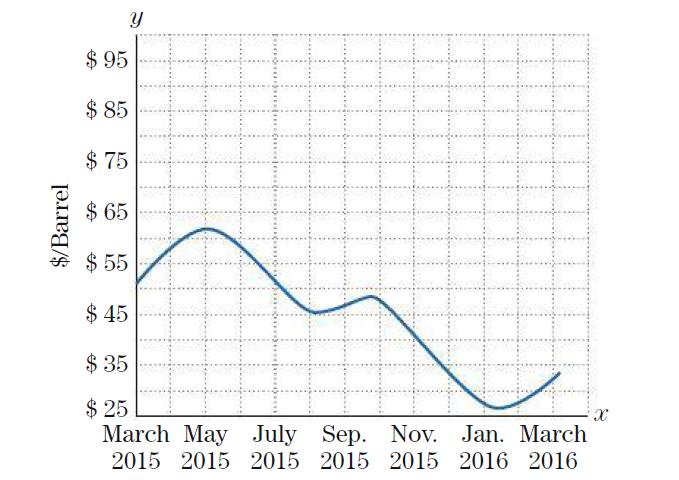
Figure 13 Price of crude oil, March 1, 2015, to March 1, 2016.
Fantastic news! We've Found the answer you've been seeking!
Step by Step Answer:
March 1 2015 about 520...View the full answer

Answered By
GERALD KAMAU
non-plagiarism work, timely work and A++ work
6+ Reviews
11+ Question Solved
Related Book For 
Calculus And Its Applications
ISBN: 9780134437774
14th Edition
Authors: Larry Goldstein, David Lay, David Schneider, Nakhle Asmar
Question Posted:
