

Figure 23 shows the graph of the consumer price index for the years 1983 (t = 0)
Question:
Figure 23 shows the graph of the consumer price index for the years 1983 (t = 0) through 2002 (t = 19). This index measures how much a basket of commodities that costs $100 in the beginning of 1983 would cost at any given time. In what year was the rate of increase of the index greatest? The least?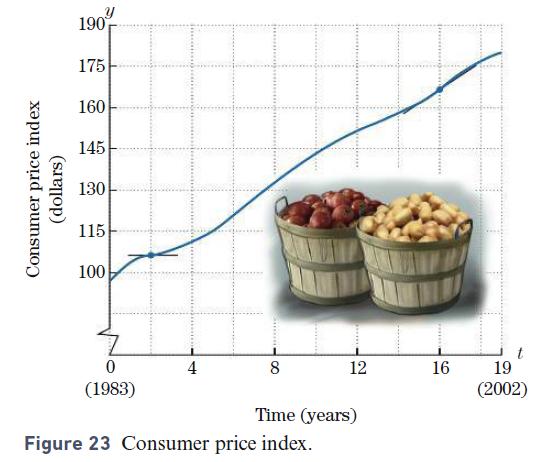
Fantastic news! We've Found the answer you've been seeking!
Step by Step Answer:

Answered By
Cristine kanyaa
I possess exceptional research and essay writing skills. I have successfully completed over 5000 projects and the responses are positively overwhelming . I have experience in handling Coursework, Session Long Papers, Manuscripts, Term papers, & Presentations among others. I have access to both physical and online library. this makes me a suitable candidate to tutor clients as I have adequate materials to carry out intensive research.
1538+ Reviews
3254+ Question Solved
Related Book For 
Calculus And Its Applications
ISBN: 9780134437774
14th Edition
Authors: Larry Goldstein, David Lay, David Schneider, Nakhle Asmar
Question Posted:
