

The graph of y = f(x) is in Figure 2.76. Does the function f(x) appear to be
Question:
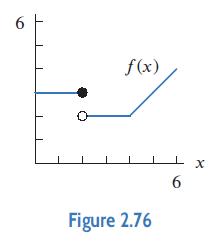
The graph of y = f(x) is in Figure 2.76. Does the function f(x) appear to be continuous on the given interval?
(a) 1 ≤ x ≤ 3
(b) 0.5 ≤ x ≤ 1.5
(c) 3 ≤ x ≤ 5
(d) 4 ≤ x ≤ 5
Fantastic news! We've Found the answer you've been seeking!
Step by Step Answer:
a No fx is not continuous on 1 x 3 beca...View the full answer

Answered By
Niala Orodi
I am a competent and an experienced writer with impeccable research and analytical skills. I am capable of producing quality content promptly. My core specialty includes health and medical sciences, but I can competently handle a vast majority of disciplines.
1+ Reviews
10+ Question Solved
Related Book For 

Applied Calculus
ISBN: 9781119275565
6th Edition
Authors: Deborah Hughes Hallett, Patti Frazer Lock, Andrew M. Gleason, Daniel E. Flath, Sheldon P. Gordon, David O. Lomen, David Lovelock, William G. McCallum, Brad G. Osgood, Andrew Pasquale
Question Posted:
