

A two-level factorial experiment in four factors was conducted by Chrysler and described in the article Sheet
Question:
(a) Estimate the factor effects and use a normal probability plot to tentatively identify the important factors.
(b) Fit an appropriate model using the factors identified in part (a).
(c) Plot the residuals from this model versus the predicted number of defects. Also prepare a normal probability plot of the residuals. Comment on the adequacy of these plots.
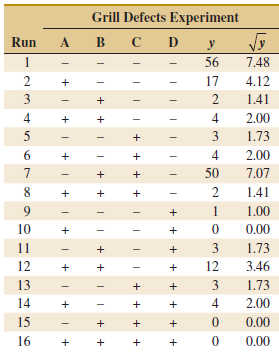
(d) The following table also shows the square root of the number of defects.
Repeat parts (a) and (c) of the analysis using the square root of the number of defects as the response. Does this change the conclusions?
Fantastic news! We've Found the answer you've been seeking!
Step by Step Answer:
a Estimated Effects and Coefficients for y coded units Effects D and BCD are signi...View the full answer

Answered By
Irfan Ali
I have a first class Accounting and Finance degree from a top university in the World. With 5+ years experience which spans mainly from the not for profit sector, I also have vast experience in preparing a full set of accounts for start-ups and small and medium-sized businesses. My name is Irfan Ali and I am seeking a wide range of opportunities ranging from bookkeeping, tax planning, business analysis, Content Writing, Statistic, Research Writing, financial accounting, and reporting.
249+ Reviews
530+ Question Solved
Related Book For 

Applied Statistics And Probability For Engineers
ISBN: 9781118539712
6th Edition
Authors: Douglas C. Montgomery, George C. Runger
Question Posted:
