

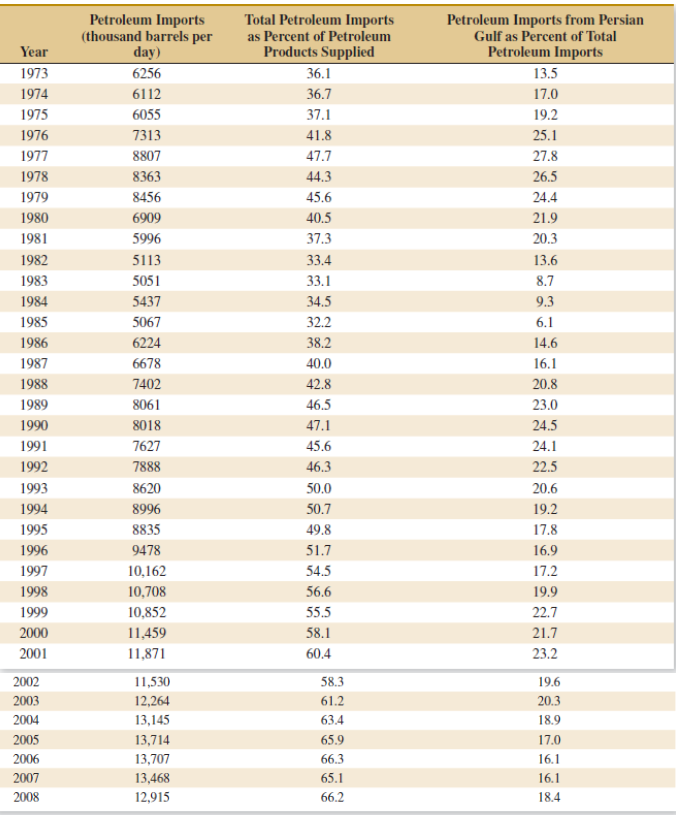
Table 6E.4 shows U.S. petroleum imports as a percentage of the totals, and Persian Gulf imports as
Question:
Table 6E.4
Fantastic news! We've Found the answer you've been seeking!
Step by Step Answer:
Stemandleaf of Petroleum Imports N 36 Leaf Unit 100 Steman...View the full answer

Answered By
Sultan Ghulam Dastgir
The following are details of my Areas of Effectiveness English Language Proficiency, Organization Behavior , consumer Behavior and Marketing, Communication, Applied Statistics, Research Methods , Cognitive & Affective Processes, Cognitive & Affective Processes, Data Analysis in Research, Human Resources Management ,Research Project,
Social Psychology, Personality Psychology, Introduction to Applied Areas of Psychology,
Behavioral Neurosdence , Historical and Contemporary Issues in Psychology, Measurement in Psychology, experimental Psychology,
1+ Reviews
10+ Question Solved
Related Book For 

Applied Statistics And Probability For Engineers
ISBN: 9781118539712
6th Edition
Authors: Douglas C. Montgomery, George C. Runger
Question Posted:
