

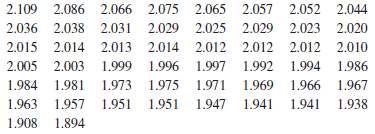
The following data (in Drink) represent the amount of soft drink filled in a sample of 50
Question:
The following data (in Drink) represent the amount of soft drink filled in a sample of 50 consecutive 2-liter bottles. The results, listed horizontally in the order of being filled, were:
a. At the 0.05 level of significance, is there evidence that the mean amount of soft drink filled is different from 2.0 liters?
b. Determine the p-value in (a) and interpret its meaning.
c. In (a), you assumed that the distribution of the amount of soft drink filled was normally distributed. Evaluate this assumption by constructing a boxplot or a normal probability plot.
d. Do you think that the assumption needed in order to conduct the t test in (a) is valid? Explain.
e. Examine the values of the 50 bottles in their sequential order, as given in the problem. Does there appear to be a pattern to the results? If so, what impact might this pattern have on the validity of the results in (a)?
DistributionThe word "distribution" has several meanings in the financial world, most of them pertaining to the payment of assets from a fund, account, or individual security to an investor or beneficiary. Retirement account distributions are among the most...
Step by Step Answer:
a Decision Since t STAT 20096 do not reject H 0 There is not enough evidence to conclude that the ...View the full answer


Basic Business Statistics Concepts And Applications
ISBN: 9780134684840
14th Edition
Authors: Mark L. Berenson, David M. Levine, Kathryn A. Szabat, David F. Stephan
