

The following data, stored in CoreAppliances provide the total number of shipments of core major household appliances
Question:
The following data, stored in CoreAppliances provide the total number of shipments of core major household appliances in the U.S. from 2000 to 2016 (in millions).
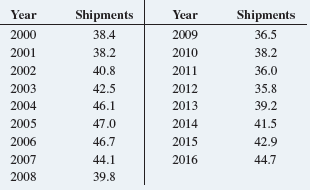
a. Plot the time series.
b. Fit a three-year moving average to the data and plot the results.
c. Using a smoothing coefficient of W = 0.50, exponentially smooth the series and plot the results.
d. What is your exponentially smoothed forecast for 2017?
e. Repeat (c) and (d), using W = 0.25.
f. Compare the results of (d) and (e).
g. What conclusions can you reach concerning the total number of shipments of core major household appliances in the U.S. from 2000 to 2016 (in millions)?
Step by Step Answer:
a b ce d Y 2017 E 2016 430011 e Y 2017 E 2016 413653 f The expo...View the full answer


Basic Business Statistics Concepts And Applications
ISBN: 9780134684840
14th Edition
Authors: Mark L. Berenson, David M. Levine, Kathryn A. Szabat, David F. Stephan
