

The following table represents the market share (in number of movies, gross in millions of dollars, and
Question:
The following table represents the market share (in number of movies, gross in millions of dollars, and millions of tickets sold) of each type of movie in 2016:
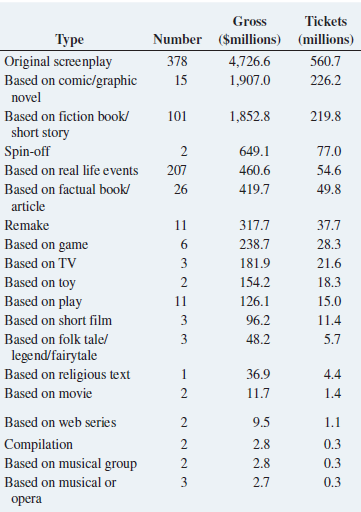
a. Construct a bar chart, a pie chart, a doughnut chart, and a Pareto chart for the number of movies, gross (in $millions), and number of tickets sold (in millions).
b. What conclusions can you reach about the market shares of the different types of movies in 2016?
Fantastic news! We've Found the answer you've been seeking!
Step by Step Answer:
a Number of Movies Tickets Sold b Based on the Pareto chart for the number of movies Original screen...View the full answer

Answered By
JAPHETH KOGEI
Hi there. I'm here to assist you to score the highest marks on your assignments and homework. My areas of specialisation are:
Auditing, Financial Accounting, Macroeconomics, Monetary-economics, Business-administration, Advanced-accounting, Corporate Finance, Professional-accounting-ethics, Corporate governance, Financial-risk-analysis, Financial-budgeting, Corporate-social-responsibility, Statistics, Business management, logic, Critical thinking,
So, I look forward to helping you solve your academic problem.
I enjoy teaching and tutoring university and high school students. During my free time, I also read books on motivation, leadership, comedy, emotional intelligence, critical thinking, nature, human nature, innovation, persuasion, performance, negotiations, goals, power, time management, wealth, debates, sales, and finance. Additionally, I am a panellist on an FM radio program on Sunday mornings where we discuss current affairs.
I travel three times a year either to the USA, Europe and around Africa.
As a university student in the USA, I enjoyed interacting with people from different cultures and ethnic groups. Together with friends, we travelled widely in the USA and in Europe (UK, France, Denmark, Germany, Turkey, etc).
So, I look forward to tutoring you. I believe that it will be exciting to meet them.
2+ Reviews
10+ Question Solved
Related Book For 
Basic Business Statistics Concepts And Applications
ISBN: 9780134684840
14th Edition
Authors: Mark L. Berenson, David M. Levine, Kathryn A. Szabat, David F. Stephan
Question Posted:
