

The following table shown in the file TextbookCosts shows the breakdown of the costs of a typical
Question:
The following table shown in the file TextbookCosts shows the breakdown of the costs of a typical college textbook.
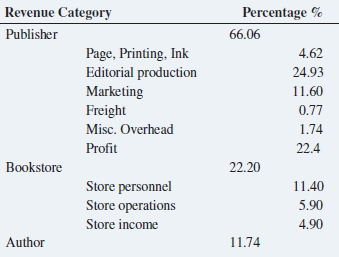
a. Using the categories of publisher, bookstore, and author, construct a bar chart, a pie chart, and a Pareto chart.
b. Using the subcategories of publisher and the subcategories of bookstore, along with the author category, construct a Pareto chart.
c. Based on the results of (a) and (b), what conclusions can you reach concerning who gets the revenue from the sales of new college textbooks? Do any of these results surprise you? Explain.
Fantastic news! We've Found the answer you've been seeking!
Step by Step Answer:
a b c The publisher gets the largest portion 6606 of the revenue 2493 is editorial production m...View the full answer

Answered By
Shadrack Mulunga
I am a Biochemistry by profession. However, I have explored different fields of study. My quest to explore new fields has helped me gain new knowledge and skills in Business, clinical psychology, sociology, organizational behavior and general management, and Project Management. I count my expertise in Project management, in particular, creation of Work Break Down Structure (WBS) and use of Microsoft Project software as one of my greatest achievement in Freelancing industry. I have helped thousands of BSC and MSC students to complete their projects on time and cost-effectively using the MS Project tool. Generally, I find happiness in translating my knowledge and expertise to success of my clients. So far, i have helped thousands of students to not only complete their projects in time but also receive high grades in their respective courses. Quality and timely delivery are the two key aspects that define my work. All those who hired my services always come back for my service. If you hire my services today, you will surely return for more. Try me today!
154+ Reviews
289+ Question Solved
Related Book For 
Basic Business Statistics Concepts And Applications
ISBN: 9780134684840
14th Edition
Authors: Mark L. Berenson, David M. Levine, Kathryn A. Szabat, David F. Stephan
Question Posted:
