Question:
Refer to the Baseball 2019 data, which report information on the 30 Major League Baseball teams for the 2019 season. At the .05 significance level, can we conclude that there is a difference in the mean salary of teams in the American League versus teams in the National League? At the .05 significance level, can we conclude that there is a difference in the mean home attendance of teams in the American League versus teams in the National League? Compute the mean and the standard deviation of the number of wins for the 10 teams with the highest salaries. Do the same for the 10 teams with the lowest salaries. At the .05 significance level, is there a difference in the mean number of wins for the two groups? At the .05 significance level, is there a difference in the mean attendance for the two groups?
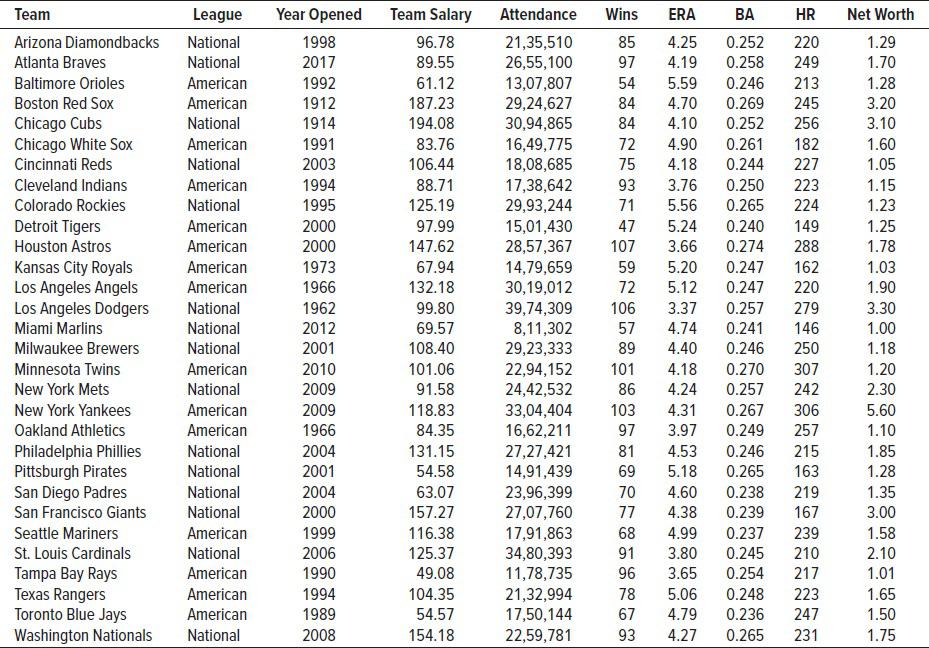
Transcribed Image Text:
Team
Arizona Diamondbacks
Atlanta Braves
Baltimore Orioles
Boston Red Sox
Chicago Cubs
Chicago White Sox
Cincinnati Reds
Cleveland Indians
Colorado Rockies
Detroit Tigers
Houston Astros
Kansas City Royals
Los Angeles Angels
Los Angeles Dodgers
Miami Marlins
Milwaukee Brewers
Minnesota Twins
New York Mets
New York Yankees
Oakland Athletics
Philadelphia Phillies
Pittsburgh Pirates
San Diego Padres
San Francisco Giants
Seattle Mariners
St. Louis Cardinals
Tampa Bay Rays
Texas Rangers
Toronto Blue Jays
Washington Nationals
League
National
National
American
American
National
American
National
American
National
American
American
American
American
National
National
National
American
National
American
American
National
National
National
National
American
National
American
American
American
National
Year Opened
1998
2017
1992
1912
1914
1991
2003
1994
1995
2000
2000
1973
1966
1962
2012
2001
2010
2009
2009
1966
2004
2001
2004
2000
1999
2006
1990
1994
1989
2008
Team Salary
96.78
89.55
61.12
187.23
194.08
83.76
106.44
88.71
125.19
97.99
147.62
67.94
132.18
99.80
69.57
108.40
101.06
91.58
118.83
84.35
131.15
54.58
63.07
157.27
116.38
125.37
49.08
104.35
54.57
154.18
Attendance Wins ERA
85 4.25
4.19
97
54
84
4.70
84 4.10
21,35,510
26,55,100
13,07,807
29,24,627
30,94,865
16,49,775
18,08,685
17,38,642
29,93,244
15,01,430 47
28,57,367 107
14,79,659
30,19,012
39,74,309
8,11,302
29,23,333
22,94,152
24,42,532
33,04,404
16,62,211
27,27,421
14,91,439
23,96,399
27,07,760
17,91,863
34,80,393
11,78,735
21,32,994
17,50,144
22,59,781
BA
0.252
0.258
HR
220
249
5.59 0.246 213
0.269
245
0.252
256
0.261 182
0.244
227
0.250 223
224
72 4.90
75
93
4.18
3.76
71 5.56 0.265
5.24 0.240 149
3.66 0.274 288
59 5.20
0.247 162
72 5.12
106 3.37
57 4.74
89 4.40
0.247 220
0.257 279
0.241 146
0.246 250
101
86
103
4.31 0.267
97
3.97 0.249
81 4.53 0.246
69
5.18 0.265
4.18 0.270
307
4.24 0.257 242
306
257
215
163
70
0.238 219
4.60
4.38
68 4.99
77
0.239 167
0.237 239
0.245 210
0.254 217
91 3.80
96 3.65
78 5.06
67 4.79
93 4.27 0.265 231
0.248 223
0.236 247
Net Worth
1.29
1.70
1.28
3.20
3.10
1.60
1.05
1.15
1.23
1.25
1.78
1.03
1.90
3.30
1.00
1.18
1.20
2.30
5.60
1.10
1.85
1.28
1.35
3.00
1.58
2.10
1.01
1.65
1.50
1.75