

Verify each identity by comparing the graph of the left side with the graph of the right
Question:
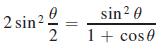
Verify each identity by comparing the graph of the left side with the graph of the right side on a calculator.
Fantastic news! We've Found the answer you've been seeking!
Step by Step Answer:
The graph of the left hand side ...View the full answer

Answered By
Rishi Anand
Hello and welcome to my profile.Let me introduce myself.I am Laiba Ayyub.I am Master degree holder.I got my Masters degree in Mathematics from Riphah International University Islamabad.I have been a good student.I am teaching many students right now.I taught in a High private school in my city.I also take classes in evening from class 8th to 14th.I am expert in doing maths.I believe in students satisfaction.
0 Reviews
10+ Question Solved
Related Book For 

Basic Technical Mathematics
ISBN: 9780137529896
12th Edition
Authors: Allyn J. Washington, Richard Evans
Question Posted:
