

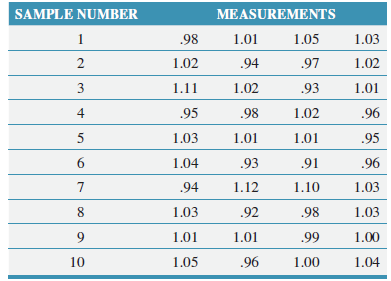
A dairy company in the Manufacturing database tests its quart milk container fills for volume in four-container
Question:
Fantastic news! We've Found the answer you've been seeking!
Step by Step Answer:
The data are entered into Minitab in one column in order with all four of the each samples values pl...View the full answer

Answered By
John Kago
Am a processional practicing accountant with 5 years experience in practice, I also happens to have hands on experience in economic analysis and statistical research for 3 years. am well conversant with Accounting packages, sage, pastel, quick books, hansa world, etc, I have real work experience with Strata, and SPSS
31+ Reviews
77+ Question Solved
Related Book For 

Business Statistics For Contemporary Decision Making
ISBN: 978-1119320890
9th edition
Authors: Ken Black
Question Posted:
