

1. If you repeat the dice game several times, or perhaps in a class, you might find...
Question:
2. Is Pink the best mix of Red and White? There€™s no rule that says a portfolio has to be an equal mix of two investments.
(a) Find the mean and variance of a portfolio that has 60% invested in White and 40% invested in Red.
(b) Does the portfolio in (a) outperform Pink in the long run?
(c) How might you find a better mixture of Red and White?
3. The example portfolio Pink mixes Red and White. Might an investment that mixed Green and Red perform better?
(a) Find the mean and variance of a portfolio that mixes half Red and half Green.
(b) Does this new mixture outperform Pink in the long run?
4. A portfolio can contain more than two items, such as a mixture of Red, White, and Green. Consider the portfolio that has 40% Red, 50% Green, and 10% White.
(a) Find the mean and variance of this portfolio.
(b) Compare the long-run performance of this portfolio to a Pink.
(c) Is this the best mixture of the three investments, from a long-run point of view? (Keep all of the shares between 0 and 1.)
5. Red is artificial; we don€™t know an investment that would work so well if paired with returns on Treasuries (White). What other attribute of the simulation is artificial? (This attribute makes it easy to find the variance of Pink.)
6. The role of randomness in investing has parallels in gambling, such as in the following game. Consider a slot machine. When you put in x dollars and pull the handle, it randomly pays out either 0.7x, 0.8x, 0.9x, 1.1x, 1.2x, or 1.5x. The payouts are equally likely. Here are two ways to play with the machine.
(a) Put in $1, pull the handle, and keep what you get. Repeat.
(b) First, put in $1 and pull the handle. Then put back into the machine whatever the machine pays. Repeat.
(c) Can you win money with either approach? Which is the better way to play? (We suggest using dice to simulate these methods.)
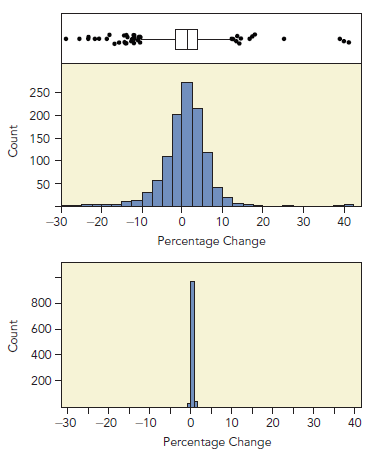
When it comes to investments, risk is the variance of the percentage changes in value (returns) over time. The two histograms in Figure 1 summarize monthly percentage changes of two investments.
The histogram on the top shows monthly percentage changes on the stock market from 1926 through 2015; the histogram on the bottom shows US Treasury Bills (basically, a short-term savings bond). There€™s almost no month-to-month variation (on this scale) in Treasuries. The stock market is much riskier. Sometimes stocks go up a lot (the largest monthly increase is 38%), and other times go down. This variation in what happens from month to month is risk.
If stocks are so risky, why does anyone buy them? The answer is simple: stocks offer the otential for higher gains as compensation for taking risks. Stocks over these years grew on average 11% annually, compared to less than 4% for Treasuries. Is this enough reward for the risk? If those were your retirement dollars, would you put the money into stocks?
It€™s not an easy question to answer. The following simulation shows you how to understand the relationship between risk and reward. Several questions along the way get you to think before you simulate, and then contrast what you expected to happen with the observed outcome.
THE DICE GAME
To learn about risks, we are going to simulate a small financial market comprised of three investments. We can do the simulation with a computer, but it€™s more interesting to watch the investments evolve as we roll dice that determine how the investments perform. Three dice simulate three investments. Each roll of all three determines what happens in a €œyear€ in this market. Doing the simulation as a team works well if you have three people. One person rolls the dice, another keeps track of the dice and reads off their values, and a third records the outcomes.
The investments represented by the dice are rather different. One investment meets our intuitive definition of a risky investment like stocks, whereas another resembles Treasuries. A third lies between these extremes. These investments have the characteristics shown in Table 1. The labeling matches colors of widely available dice.
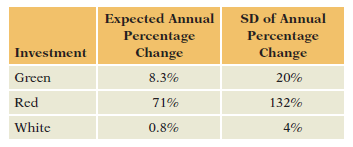
Here€™s how to interpret Table 1. Suppose we start with +1,000 in the investment called Red. Table 1 says to expect the value of our investment to be 71% larger at the end of a year, growing on average to +1,710. Similarly, after one year, +1,000 in Green grows on average to +1,083 and +1,008 in White.
Red is the best choice if we only care about what happens on average. We€™ve learned, however, that variances are important as well. The standard deviation of Red is the largest of the three, 132%. Not only does Red offer the largest average growth, but it promises large gains and losses. How should we balance the average growth for Red versus its standard deviation? The average return on Red is 8.5 times that for Green, but its SD is 6.6 times larger than the SD for Green. Is this a good trade-off?
StocksStocks or shares are generally equity instruments that provide the largest source of raising funds in any public or private listed company's. The instruments are issued on a stock exchange from where a large number of general public who are willing... Portfolio
A portfolio is a grouping of financial assets such as stocks, bonds, commodities, currencies and cash equivalents, as well as their fund counterparts, including mutual, exchange-traded and closed funds. A portfolio can also consist of non-publicly...
Step by Step Answer:
1 Luck The expected value for Red is 100017120 45700000 Typically Red loses value because of its vol...View the full answer


Statistics For Business Decision Making And Analysis
ISBN: 9780134497167
3rd Edition
Authors: Robert A. Stine, Dean Foster
