

Building permits are a leading indicator of economic growth. But do non-residential permits follow the same pattern
Question:
Building permits are a leading indicator of economic growth. But do non-residential permits follow the same pattern as residential permits? Statistics Canada provides us with the requisite data in Table 260-0003, Building Permits, Values by Activity Sector. The graph shows the value of each type of permit in each Canadian province and territory (in $ billion) for the first nine months of 2015: 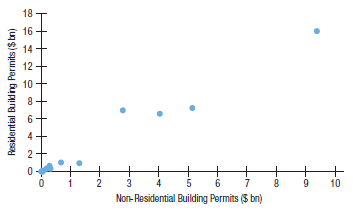
a) Obtain a regression analysis of residential permits (RP) on the vertical axis against non-residential permits (NRP) as the explanatory variable on the horizontal axis. Write the regression equation.
b) What is the t-statistic and P-value for the slope coefficient? Is the slope significant? Explain.
c) The point at the top right of the scatterplot corresponds to Ontario. Is Ontario an outlier?
d) Does Ontario have high leverage?
e) Remove the point for Ontario and repeat the regression analysis. Write the regression equation.
f) By how many standard errors does the slope coefficient change when we remove Ontario? Is Ontario influential in this regression? Why?
g) Should the Durbin-Watson test be applied to the regression residuals? Explain. You are not actually asked to calculate it.
h) Would the regression model be improved by transforming the data? Explain.
Step by Step Answer:
a Coefficients Standard Error t Stat Pvalue Intercept 002511617 0302749233 00829603 09353735 NRP 167...View the full answer


Business Statistics
ISBN: 9780133899122
3rd Canadian Edition
Authors: Norean D. Sharpe, Richard D. De Veaux, Paul F. Velleman, David Wright
