

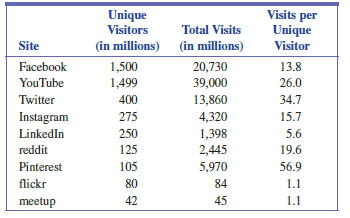
The accompanying table gives the total number visits and the number of unique visitors for some popular
Question:
The accompanying table gives the total number visits and the number of unique visitors for some popular social networking sites in the United States for the month of July 2017. The number of unique visitors data are taken from the online article ?Top 15 Most Popular Social Networking Sites? (ism .org/images/files/Social-media-platforms-from -Engage-to-Succeed-webinar.pdf, retrieved February 7, 2018). The total number of visits were estimated using data from semrush.com (retrieved February 7, 2018). The data on total visits and unique visitors were used to compute the values in the final column of the data table, in which visits per unique visitor = total visits / number of unique visitors
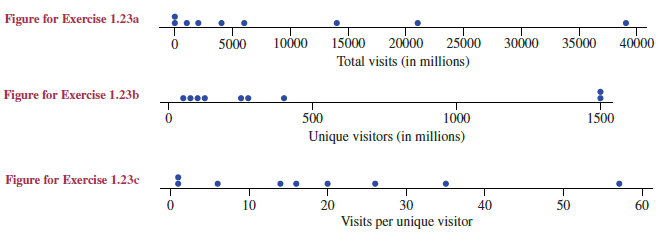
a. A dotplot of the total visits data is shown at the top of the page. What are the most obvious features of the dotplot? What does it tell you about the online social networking sites?
b. A dotplot for the number of unique visitors is shown at the top of the page. In what way is this dotplot different from the dotplot for total visits in Part (a)? What does this tell you about the online social networking sites?
c. A dotplot for the visits per unique visitor data is shown at the top of the page. What new information about the online social networks is provided by this dotplot?
Step by Step Answer:
a The dotplot shows that there were three sites that received far greater numbers of visits than the ...View the full answer


Introduction To Statistics And Data Analysis
ISBN: 9781337793612
6th Edition
Authors: Roxy Peck, Chris Olsen, Tom Short
