

The amount of money spent each year on science, space, and technology in the United States (in
Question:
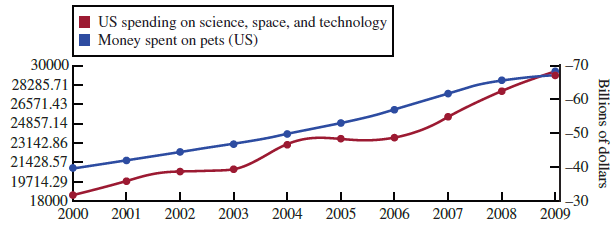
The amount of money spent each year on science, space, and technology in the United States (in millions of dollars) and the amount of money spent on pets in the United States (in billions of dollars) for the years 2000 to 2009 were used to construct the graph below. (The data are from the web site tylervigen.com/spurious correlations, accessed August 28, 2016).
Based on these time series plots, would the correlation coefficient between amount spent on science, space, and technology and the amount spent on pets be positive or negative? Weak or strong? What aspect of the time series plots support your answer?
Fantastic news! We've Found the answer you've been seeking!
Step by Step Answer:
The correlation coefficient will be positive ...View the full answer

Answered By
Sandip Nandnawar
I am a B.E (Information technology) from GECA and also have an M.C.M from The University of RTMNU, MH.
I worked as a software developer (Programmer and TL). Also working as an expert for the last 6 years and deal with complex assessment and projects. I have a team and lead a team of experts and conducted primary and secondary research. I am a senior software engg and senior expert and deal with all types of CSE and IT and other IT-related assessments and projects and homework.
1+ Reviews
10+ Question Solved
Related Book For 

Introduction To Statistics And Data Analysis
ISBN: 9781337793612
6th Edition
Authors: Roxy Peck, Chris Olsen, Tom Short
Question Posted:
