

The claims about climate change suggest two possible effects: more storms and bigger, stronger storms. Here are
Question:
The claims about climate change suggest two possible effects: more storms and bigger, stronger storms. Here are plots similar to those of Exercise 65, but for major hurricanes. (Data in Hurricane history)
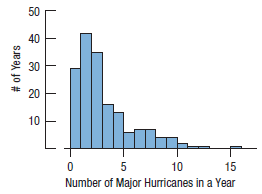
a) Describe the distribution. Here is the time series plot of these data, along with a smooth trace.
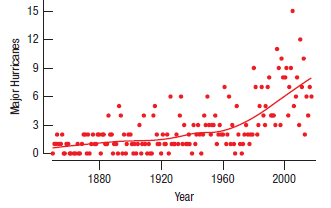
b) Discuss the time series plot. Does it support the claim of increasing numbers of major hurricanes?
c) What can you see from the time series plot that you couldn?t see in the histogram? What can you see in the histogram that you can?t see in the time series plot?
Fantastic news! We've Found the answer you've been seeking!
Step by Step Answer:
a The distribution is unimodal and strongly skewed to the right As with tropica...View the full answer

Answered By
Somshukla Chakraborty
I have a teaching experience of more than 4 years by now in diverse subjects like History,Geography,Political Science,Sociology,Business Enterprise,Economics,Environmental Management etc.I teach students from classes 9-12 and undergraduate students.I boards I handle are IB,IGCSE, state boards,ICSE, CBSE.I am passionate about teaching.Full satisfaction of the students is my main goal.
I have completed my graduation and master's in history from Jadavpur University Kolkata,India in 2012 and I have completed my B.Ed from the same University in 2013. I have taught in a reputed school of Kolkata (subjects-History,Geography,Civics,Political Science) from 2014-2016.I worked as a guest lecturer of history in a college of Kolkata for 2 years teaching students of 1st ,2nd and 3rd year. I taught Ancient and Modern Indian history there.I have taught in another school in Mohali,Punjab teaching students from classes 9-12.Presently I am working as an online tutor with concept tutors,Bangalore,India(Carve Niche Pvt.Ltd.) for the last 1year and also have been appointed as an online history tutor by Course Hero(California,U.S) and Vidyalai.com(Chennai,India).
2+ Reviews
10+ Question Solved
Related Book For 
Business Statistics
ISBN: 9780134705217
4th Edition
Authors: Norean Sharpe, Richard Veaux, Paul Velleman
Question Posted:
