

The following graphical display is similar to one that appeared in USA TODAY (January 8, 2010).? Use
Question:
The following graphical display is similar to one that appeared in USA TODAY (January 8, 2010).?
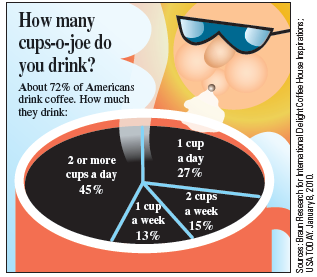
Use the information in this display to answer the following questions. Assume that the percentages in the graph are representative of adult Americans.
a. What is the probability that a randomly selected adult American drinks coffee?
b. T he display associates 45% with the category ?two or more cups a day.? For the chance experiment that consists of selecting an adult American at random, is 0.45 the probability that the selected individual drinks two or more cups of coffee a day, or is it the conditional probability that the selected individual drinks two or more cups a day given that he or she drinks coffee? Explain.
Step by Step Answer:
a 072 b The value 045 is the conditional probability that the selected indi...View the full answer


Introduction To Statistics And Data Analysis
ISBN: 9781337793612
6th Edition
Authors: Roxy Peck, Chris Olsen, Tom Short
