

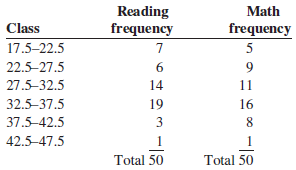
The frequency distributions shown indicate the percentages of public school students in fourth-grade reading and mathematics who
Question:
Fantastic news! We've Found the answer you've been seeking!
Step by Step Answer:
The distribution of math percentages is more bellshaped than the dis...View the full answer

Answered By
Issa Shikuku
I have vast experience of four years in academic and content writing with quality understanding of APA, MLA, Harvard and Chicago formats. I am a dedicated tutor willing to hep prepare outlines, drafts or find sources in every way possible. I strive to make sure my clients follow assignment instructions and meet the rubric criteria by undertaking extensive research to develop perfect drafts and outlines. I do this by ensuring that i am always punctual and deliver quality work.
6+ Reviews
13+ Question Solved
Related Book For 
Elementary Statistics A Step By Step Approach
ISBN: 9781259755330
10th Edition
Authors: Allan G. Bluman
Question Posted:
