

The histogram shows themonthly U.S. unemployment rate from January 2003 toAugust 2017. Here is the time series
Question:
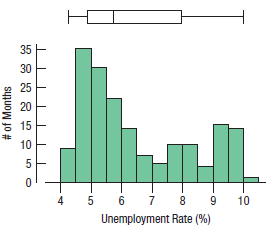
The histogram shows themonthly U.S. unemployment rate from January 2003 toAugust 2017.
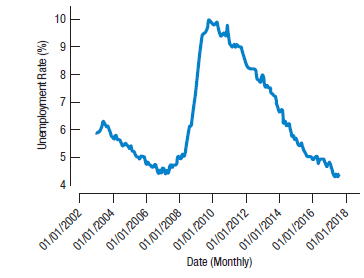
Here is the time series plot for the same data.
a) What features of the data can you see in the histogram that aren?t clear in the time series plot?
b) What features of the data can you see in the time series plot that aren?t clear in the histogram?
c) Which graphical display seems the more appropriate for these data? Explain.
d) Write a brief description of unemployment rates over this time period in the United States.
Fantastic news! We've Found the answer you've been seeking!
Step by Step Answer:
a The histogram shows that the distribution is bimodal ...View the full answer

Answered By
Aysha Ali
my name is ayesha ali. i have done my matriculation in science topics with a+ . then i got admission in the field of computer science and technology in punjab college, lahore. i have passed my final examination of college with a+ also. after that, i got admission in the biggest university of pakistan which is university of the punjab. i am studying business and information technology in my university. i always stand first in my class. i am very brilliant client. my experts always appreciate my work. my projects are very popular in my university because i always complete my work with extreme devotion. i have a great knowledge about all major science topics. science topics always remain my favorite topics. i am also a home expert. i teach many clients at my home ranging from pre-school level to university level. my clients always show excellent result. i am expert in writing essays, reports, speeches, researches and all type of projects. i also have a vast knowledge about business, marketing, cost accounting and finance. i am also expert in making presentations on powerpoint and microsoft word. if you need any sort of help in any topic, please dont hesitate to consult with me. i will provide you the best work at a very reasonable price. i am quality oriented and i have 5 year experience in the following field.
matriculation in science topics; inter in computer science; bachelors in business and information technology
_embed src=http://www.clocklink.com/clocks/0018-orange.swf?timezone=usa_albany& width=200 height=200 wmode=transparent type=application/x-shockwave-flash_
11+ Reviews
14+ Question Solved
Related Book For 
Business Statistics
ISBN: 9780134705217
4th Edition
Authors: Norean Sharpe, Richard Veaux, Paul Velleman
Question Posted:
