

The report ?Airline Quality Rating 2016? (airlinequalityrating.com/reports/2016_AQR_Final.pdf, retrieved April 22, 2017) included the data for 13 U.S.
Question:
The report ?Airline Quality Rating 2016? (airlinequalityrating.com/reports/2016_AQR_Final.pdf, retrieved April 22, 2017) included the data for 13 U.S. airlines given in the table below.
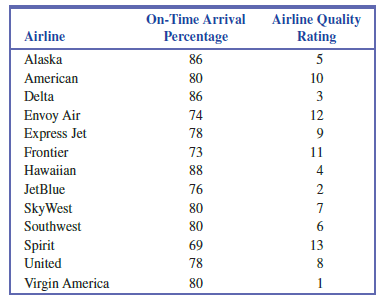
a. With x 5 Airline quality rating and y 5 On-time arrival percentage, construct a scatterplot. Does the pattern in the scatterplot look linear?
b. Find the equation of the least-squares line.
c. Calculate the residuals and construct a residual plot. Are there any unusual features in the residual plot?
Fantastic news! We've Found the answer you've been seeking!
Step by Step Answer:
a No the pattern in the scatterplot does not look linear There ...View the full answer

Answered By
PALASH JHANWAR
I am a Chartered Accountant with AIR 45 in CA - IPCC. I am a Merit Holder ( B.Com ). The following is my educational details.
PLEASE ACCESS MY RESUME FROM THE FOLLOWING LINK: https://drive.google.com/file/d/1hYR1uch-ff6MRC_cDB07K6VqY9kQ3SFL/view?usp=sharing
3+ Reviews
10+ Question Solved
Related Book For 

Introduction To Statistics And Data Analysis
ISBN: 9781337793612
6th Edition
Authors: Roxy Peck, Chris Olsen, Tom Short
Question Posted:
