

The U.S. Department of Health and Human Services reported the estimated percentage of households with only wireless
Question:
The U.S. Department of Health and Human Services reported the estimated percentage of households with only wireless phone service (no landline) in 2014 for the 50 states and the District of Columbia (cdc.gov/nchs/data/nhis/earlyrelease/wireless_state_201602.pdf, retrieved February 8, 2018). In the accompanying data table, each state was also classified into one of three geographical regions?West (W), Middle states (M), and East (E).
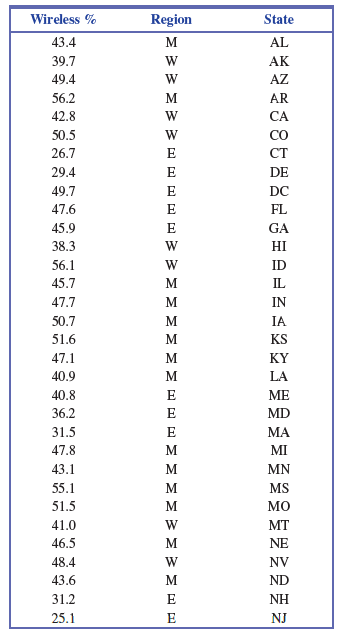
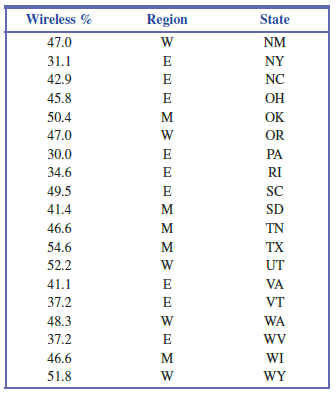
a. Display the data graphically in a way that makes it possible to compare wireless percent for the three geographical regions.
b. Does the graphical display in Part (a) reveal any striking differences in wireless percent for the three geographical regions or are the distributions of wireless percent observations similar for the three regions?
Step by Step Answer:
a b Looking at the dotplot we can see that Eastern st...View the full answer


Introduction To Statistics And Data Analysis
ISBN: 9781337793612
6th Edition
Authors: Roxy Peck, Chris Olsen, Tom Short
