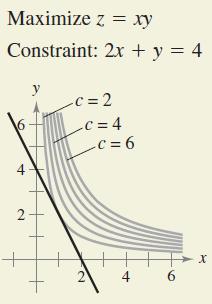
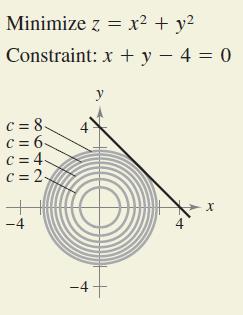
The graphs show the constraint and several level curves of the objective function. Use the graph to
Question:
The graphs show the constraint and several level curves of the objective function. Use the graph to approximate the indicated extrema.
(a)
(b)
Transcribed Image Text:
Maximize z = xy Constraint: 2x + y = 4 4 2 y + -c = 2 _c=4 -C=6 4 6 X
Fantastic news! We've Found the answer you've been seeking!
Step by Step Answer:
Answer rating: 66% (6 reviews)
a 1...View the full answer

Answered By

Shameen Tahir
The following are details of my Areas of Effectiveness. The following are details of my Areas of Effectiveness English Language Proficiency, Organization Behavior , consumer Behavior and Marketing, Communication, Applied Statistics, Research Methods , Cognitive & Affective Processes, Cognitive & Affective Processes, Data Analysis in Research, Human Resources Management ,Research Project,
Social Psychology, Personality Psychology, Introduction to Applied Areas of Psychology,
Behavioral Neurosdence , Historical and Contemporary Issues in Psychology, Measurement in Psychology, experimental Psychology,
Business Ethics Business Ethics An introduction to business studies Organization & Management Legal Environment of Business Information Systems in Organizations Operations Management Global Business Policies Industrial Organization Business Strategy Information Management and Technology Company Structure and Organizational Management Accounting & Auditing Financial Accounting Managerial Accounting Accounting for strategy implementation Financial accounting Introduction to bookkeeping and accounting Marketing Marketing Management Professional Development Strategies Business Communications Business planning Commerce & Technology Human resource management General Management Conflict management Leadership Organizational Leadership Supply Chain Management Law Corporate Strategy Creative Writing Analytical Reading & Writing Other Expertise Risk Management Entrepreneurship Management science Organizational behavior Project management Financial Analysis, Research & Companies Valuation And any kind of Excel Queries.
4.70+
16+ Reviews
34+ Question Solved
Related Book For 

Question Posted:
Students also viewed these Mathematics questions
-
Graph several level curves of the following function using the given window. Label at least two level curves with their z-values. z= 6x-2y: [-2,2] x[-2,2] Choose the correct graph below. O B. OD. O A.
-
In this problem we identify a point (a, b) on the line 16x + 15y = 100 such that the sum of the distances from (3, 0) to sa, bd and from (a, b) to (3, 0) is a minimum. (a) Write a function f that...
-
Consider the problem of maximizing the function f(x, y) = 2x + 3y subject to the constraint x + y = 5. (a) Try using Lagrange multipliers to solve the problem. (b) Does f(25, 0) give a larger value...
-
10. A light cord is wrapped around a wheel, R = 0.10 m and rotational inertia I about its axis and is attached to mass, m = 2 kg, see about its fixed axis and the object accelerates downward, (take g...
-
Briefly explain why it is necessary to prepare the statement of income before preparing the statement of changes in shareholders equity.
-
The Taylor series at x = 0 for f (x) = tan x is 1.3 2 17 + zx + 3x + ? 3x + +X Find / (49(0).
-
The coil in a generator has 100 windings and a crosssectional area of \(0.0100 \mathrm{~m}^{2}\). (a) If the coil turns at a constant rotational speed and the magnetic field in the generator is that...
-
Starbucks has worked hard to act ethically and responsibly. Has it done a good job communicating its efforts to consumers? Do consumers believe Starbucks is a responsible company? Why or why not?
-
29. If A 21+j+k and B=1+2j+2k, find the magnitude of component of (A+B) along B: (1) 4 unit (2) 5 unit (3) 6 unit (4) 7 unit 30. Which of the following group of forces cannot produce the resultant of...
-
(a) Use Lagrange multipliers to prove that the product of three positive numbers x, y, and z, whose sum has the constant value S, is a maximum when the three numbers are equal. Use this result to...
-
Use Lagrange multipliers to find the dimensions of a rectangular box of maximum volume that can be inscribed (with edges parallel to the coordinate axes) in the ellipsoid = 1. + 2 +
-
Given that plot the first five terms of the amplitude and phase spectra for the function. f(t)- ( 20 cos 2nt -sin 2nt
-
In labour law and arbitration, what does the term jurisprudence refer to? Past decisions Legal awards Arbitration awards Prima facie cases?
-
With the code below, explain the time complexity of this algorithm. function foo (n) ( if n == 0: return 0 if n > 0: return 5 foo (n/2) + n
-
Project life cycle refers to a generally accepted sequence of activities that provide a structured, logical approach to project activities that facilitates estimation, planning, and resource...
-
Explain the responsibility in labour law for foreign workers in Malaysia. 1. Employment Policy of Foreign Workers 2. Two (2) major issues arising from the recruitment.
-
Positive influences of technology on labor market? Negative influences of technology on labor market?
-
A telephone solicitor is responsible for canvassing three suburbs. In the past, 60% of the completed calls to Belle Meade have resulted in contributions, compared to 55% for Oak Hill and 35% for...
-
Digital Fruit is financed solely by common stock and has outstanding 25 million shares with a market price of $10 a share. It now announces that it intends to issue $160 million of debt and to use...
-
State how to compute the Simpsons Rule approximation S(2n) if the Trapezoid Rule approximations T(2n) and T(n) are known.
-
Compute the absolute and relative errors in using c to approximate x. x = ; c = 3.14
-
Compute the absolute and relative errors in using c to approximate x. x = 2; c = 1.414
-
Please provide a description of explicit and implicit financing cost implications associated with a venture's need for additional funds. How is the cost of equity capital for private ventures...
-
Presented below are the balances, listed in alphabetical order, of the Rodrigo Company, at December 1 , 2 0 1 7 : Accounts Payable 6 , 3 0 0 Accounts Receivable 4 , 1 0 0 Cash 7 , 2 0 0 Land 1 5 , 2...
-
The difference between the VaR and historical CVaR is very huge and the worst drawdown exceeds the VaR estimate 432 times in a period of 10 years. What are the impacts to the risk management decision...

Study smarter with the SolutionInn App


