

The table shows the world populations y (in billions) for five different years. Let x = 3
Question:
The table shows the world populations y (in billions) for five different years. Let x = 3 represent the year 2003.
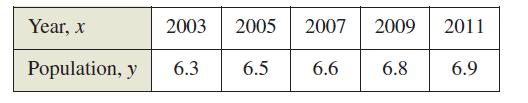
(a) Use the regression capabilities of a graphing utility to find the least squares regression line for the data.
(b) Use the regression capabilities of a graphing utility to find the least squares regression quadratic for the data.
(c) Use a graphing utility to plot the data and graph the models.
(d) Use both models to forecast the world population for the year 2020. How do the two models differ as you extrapolate into the future?
Fantastic news! We've Found the answer you've been seeking!
Step by Step Answer:
a Using a graphing ...View the full answer

Answered By
Bree Normandin
Success in writing necessitates a commitment to grammatical excellence, a profound knack to pursue information, and a staunch adherence to deadlines, and the requirements of the individual publication. My background comprises writing research projects, research meta-analyses, literature reviews, white paper reports, multimedia projects, reports for peer-reviewed journals, among others. I work efficiently, with ease and deliver high-quality outputs within the stipulated deadline. I am proficient in APA, MLA, and Harvard referencing styles. I have good taste in writing and reading. I understand that this is a long standing and coupled with excellent research skills, analysis, well-articulated expressions, teamwork, availability all summed up by patience and passion. I put primacy on client satisfaction to gain loyalty, and trust for future projects. As a detail-oriented researcher with extensive experience surpassing eight years crafting high-quality custom written essays and numerous academic publications, I am confident that I could considerably exceed your expectations for the role of a freelance academic writer.
7+ Reviews
21+ Question Solved
Related Book For 

Question Posted:
