

Draw the history graph D(x = 0 m, t) at x = 0 m for the wave
Question:
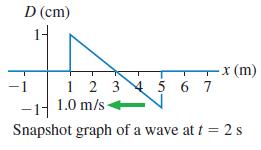
Draw the history graph D(x = 0 m, t) at x = 0 m for the wave shown in Figure EX 20.4.
Fantastic news! We've Found the answer you've been seeking!
Step by Step Answer:
Model This is a wave traveling at constant speed The pulse moves 1 m to the ...View the full answer

Answered By
Mamba Dedan
I am a computer scientist specializing in database management, OS, networking, and software development. I have a knack for database work, Operating systems, networking, and programming, I can give you the best solution on this without any hesitation. I have a knack in software development with key skills in UML diagrams, storyboarding, code development, software testing and implementation on several platforms.
60+ Reviews
144+ Question Solved
Related Book For 

Physics For Scientists And Engineers A Strategic Approach With Modern Physics
ISBN: 9780321740908
3rd Edition
Authors: Randall D. Knight
Question Posted:
