

Draw the history graph D(x = 5.0 m, t) at x = 5.0 m for the wave
Question:
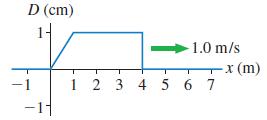
Draw the history graph D(x = 5.0 m, t) at x = 5.0 m for the wave shown in Figure EX 20.5.
Fantastic news! We've Found the answer you've been seeking!
Step by Step Answer:
Model This is a wave traveling at constant speed The pulse moves 1 ...View the full answer

Answered By
Susan Juma
I'm available and reachable 24/7. I have high experience in helping students with their assignments, proposals, and dissertations. Most importantly, I'm a professional accountant and I can handle all kinds of accounting and finance problems.
15+ Reviews
45+ Question Solved
Related Book For 

Physics For Scientists And Engineers A Strategic Approach With Modern Physics
ISBN: 9780321740908
3rd Edition
Authors: Randall D. Knight
Question Posted:
