

Figure EX 21.3 is a snapshot graph at t = 0 s of two waves approaching each
Question:
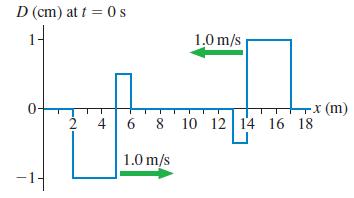
Figure EX 21.3 is a snapshot graph at t = 0 s of two waves approaching each other at 1.0 m/s. Draw four snapshot graphs, stacked vertically, showing the string at t = 2, 4, 6, and 8 s.
Fantastic news! We've Found the answer you've been seeking!
Step by Step Answer:
Model The principle of superposition comes into pla...View the full answer

Answered By
PALASH JHANWAR
I am a Chartered Accountant with AIR 45 in CA - IPCC. I am a Merit Holder ( B.Com ). The following is my educational details.
PLEASE ACCESS MY RESUME FROM THE FOLLOWING LINK: https://drive.google.com/file/d/1hYR1uch-ff6MRC_cDB07K6VqY9kQ3SFL/view?usp=sharing
3+ Reviews
10+ Question Solved
Related Book For 
Physics For Scientists And Engineers A Strategic Approach With Modern Physics
ISBN: 9780321740908
3rd Edition
Authors: Randall D. Knight
Question Posted:
