

Figure P 11.41 is the velocity-versus-time graph of a 500 g particle that starts at x =
Question:
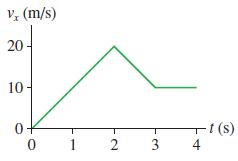
Figure P 11.41 is the velocity-versus-time graph of a 500 g particle that starts at x = 0 m and moves along the x-axis. Draw graphs of the following by calculating and plotting numerical values at t = 0, 1, 2, 3, and 4 s. Then sketch lines or curves of the appropriate shape between the points. Make sure you include appropriate scales on both axes of each graph.
a. Acceleration versus time.
b. Position versus time.
c. Kinetic energy versus time.
d. Force versus time.
e. Use your Fxversust graph to determine the impulse delivered to the particle during the time interval 0-2 s and also the interval 2-4 s.
f. Use the impulse-momentum theorem to determine the particle’s velocity at t = 2 s and at t = 4 s. Do your results agree with the velocity graph?
g. Now draw a graph of force versus position. This requires no calculations; just think carefully about what you learned in parts a to d.
h. Use your Fx-versus-x graph to determine the work done on the particle during the time interval 0-2 s and also the interval 2-4 s.
i. Use the work-kinetic energy theorem to determine the particle’s velocity at t = 2 s and at t = 4 s. Do your results agree with the velocity graph?
Step by Step Answer:
Model Use Visualize We know a x slope of the v x versust graph an...View the full answer


Physics For Scientists And Engineers A Strategic Approach With Modern Physics
ISBN: 9780321740908
3rd Edition
Authors: Randall D. Knight
