

The figure shows graphs of the temperatures for a city on the East Coast and a city
Question:
The figure shows graphs of the temperatures for a city on the East Coast and a city on the West Coast during a 24-hour period starting at midnight. Which city had the highest temperature that day? Find the average temperature during this time period for each city using the Midpoint Rule with n = 12. Interpret your results; which city was “warmer” overall that day?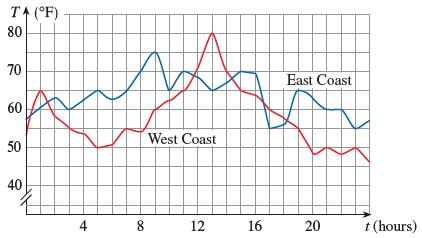
Fantastic news! We've Found the answer you've been seeking!
Step by Step Answer:
East Coast E West Coast Use the Midpoint Rule with E ...View the full answer

Answered By
Fahmin Arakkal
Tutoring and Contributing expert question and answers to teachers and students.
Primarily oversees the Heat and Mass Transfer contents presented on websites and blogs.
Responsible for Creating, Editing, Updating all contents related Chemical Engineering in
latex language
8+ Reviews
22+ Question Solved
Related Book For 

Calculus Early Transcendentals
ISBN: 9781337613927
9th Edition
Authors: James Stewart, Daniel K. Clegg, Saleem Watson, Lothar Redlin
Question Posted:
