

The table shows how the average age of first marriage of Japanese women has varied since 1950.
Question:
The table shows how the average age of first marriage of Japanese women has varied since 1950.
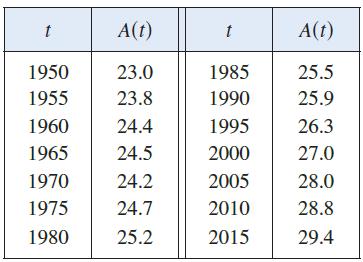
(a) Use a graphing calculator or computer to model these data with a fourth-degree polynomial.
(b) Use part (a) to find a model for A'(t).
(c) Estimate the rate of change of marriage age for women in 1990.
(d) Graph the data points and the models for A and A'.
Fantastic news! We've Found the answer you've been seeking!
Step by Step Answer:
a At at 4 bt 3 ct 2 dt e years of age where a 1404 771 ...View the full answer

Answered By
PALASH JHANWAR
I am a Chartered Accountant with AIR 45 in CA - IPCC. I am a Merit Holder ( B.Com ). The following is my educational details.
PLEASE ACCESS MY RESUME FROM THE FOLLOWING LINK: https://drive.google.com/file/d/1hYR1uch-ff6MRC_cDB07K6VqY9kQ3SFL/view?usp=sharing
3+ Reviews
10+ Question Solved
Related Book For 

Calculus Early Transcendentals
ISBN: 9781337613927
9th Edition
Authors: James Stewart, Daniel K. Clegg, Saleem Watson, Lothar Redlin
Question Posted:
