

The table shows world average daily oil consumption from 1985 to 2015, measured in thousands of barrels
Question:
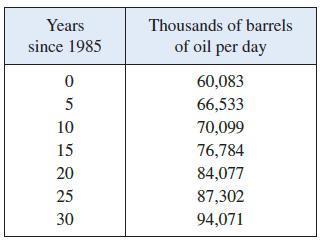
The table shows world average daily oil consumption from 1985 to 2015, measured in thousands of barrels per day.
(a) Make a scatter plot and decide whether a linear model is appropriate.
(b) Find and graph the regression line.
(c) Use the linear model to estimate the oil consumption in 2002 and 2017.
Fantastic news! We've Found the answer you've been seeking!
Step by Step Answer:
a See the scatter plot in part b A linear model seems appropriat...View the full answer

Answered By
Irfan Ali
I have a first class Accounting and Finance degree from a top university in the World. With 5+ years experience which spans mainly from the not for profit sector, I also have vast experience in preparing a full set of accounts for start-ups and small and medium-sized businesses. My name is Irfan Ali and I am seeking a wide range of opportunities ranging from bookkeeping, tax planning, business analysis, Content Writing, Statistic, Research Writing, financial accounting, and reporting.
249+ Reviews
530+ Question Solved
Related Book For 

Calculus Early Transcendentals
ISBN: 9781337613927
9th Edition
Authors: James Stewart, Daniel K. Clegg, Saleem Watson, Lothar Redlin
Question Posted:
