

Use data in Appendix C to make your own chart of stable and unstable nuclei, similar to
Question:
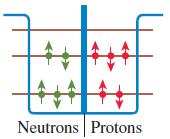
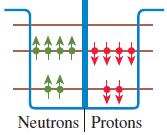
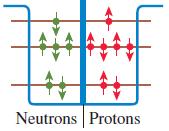
Use data in Appendix C to make your own chart of stable and unstable nuclei, similar to Figure 42.4, for all nuclei with Z ≤ 8. Use a blue or black dot to represent stable isotopes, a red dot to represent isotopes that undergo beta-minus decay, and a green dot to represent isotopes that undergo beta-plus decay or electron-capture decay.
a.
b.
c.
Fantastic news! We've Found the answer you've been seeking!
Step by Step Answer:
Solve The chart shows stable and unstable nuclei for all nuclei with Z 8 A black dot re...View the full answer

Answered By
Somshukla Chakraborty
I have a teaching experience of more than 4 years by now in diverse subjects like History,Geography,Political Science,Sociology,Business Enterprise,Economics,Environmental Management etc.I teach students from classes 9-12 and undergraduate students.I boards I handle are IB,IGCSE, state boards,ICSE, CBSE.I am passionate about teaching.Full satisfaction of the students is my main goal.
I have completed my graduation and master's in history from Jadavpur University Kolkata,India in 2012 and I have completed my B.Ed from the same University in 2013. I have taught in a reputed school of Kolkata (subjects-History,Geography,Civics,Political Science) from 2014-2016.I worked as a guest lecturer of history in a college of Kolkata for 2 years teaching students of 1st ,2nd and 3rd year. I taught Ancient and Modern Indian history there.I have taught in another school in Mohali,Punjab teaching students from classes 9-12.Presently I am working as an online tutor with concept tutors,Bangalore,India(Carve Niche Pvt.Ltd.) for the last 1year and also have been appointed as an online history tutor by Course Hero(California,U.S) and Vidyalai.com(Chennai,India).
2+ Reviews
10+ Question Solved
Related Book For 
Physics For Scientists And Engineers A Strategic Approach With Modern Physics
ISBN: 9780321740908
3rd Edition
Authors: Randall D. Knight
Question Posted:
