

Let p(t) represent the population of the Las Vegas metropolitan area t years after 1950, as shown
Question:
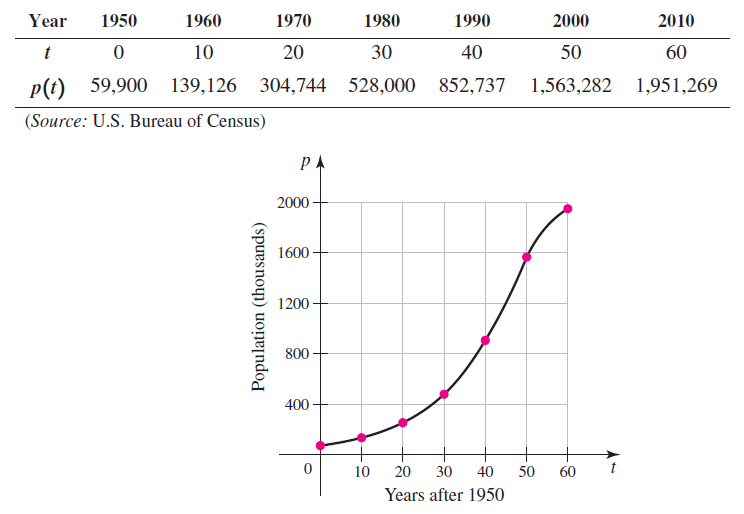
Let p(t) represent the population of the Las Vegas metropolitan area t years after 1950, as shown in the table and figure.
a. Compute the average rate of growth of Las Vegas from 1970 to 1980.
b. Explain why the average rate of growth calculated in part (a) is a good estimate of the instantaneous rate of growth of Las Vegas in 1975.
c. Compute the average rate of growth of Las Vegas from 1990 to 2000. Is the average rate of growth an overestimate or underestimate of the instantaneous rate of growth of Las Vegas in 2000? Approximate the growth rate in 2000.
Fantastic news! We've Found the answer you've been seeking!
Step by Step Answer:
a The average rate of growth is the slope of the secant line b...View the full answer

Answered By
Sheikh Muhammad Ibrahim
During the course of my study, I have worked as a private tutor. I have taught Maths and Physics to O'Level and A'Level students, as well as I have also taught basic engineering courses to my juniors in the university. Engineering intrigues me alot because it a world full of ideas. I have passionately taught students and this made me learn alot. Teaching algebra and basic calculus, from the very basics of it made me very patient. Therefore, I know many tricks to make your work easier for you. I believe that every student has a potential to work himself. I am just here to polish your skills. I am a bright student in my university. My juniors are always happy from me because I help in their assignments and they are never late.
14+ Reviews
24+ Question Solved
Related Book For 

Calculus Early Transcendentals
ISBN: 978-0321947345
2nd edition
Authors: William L. Briggs, Lyle Cochran, Bernard Gillett
Question Posted:
