

Suppose p(t) represents the population of the United States (in millions) t years after the year 1900.
Question:
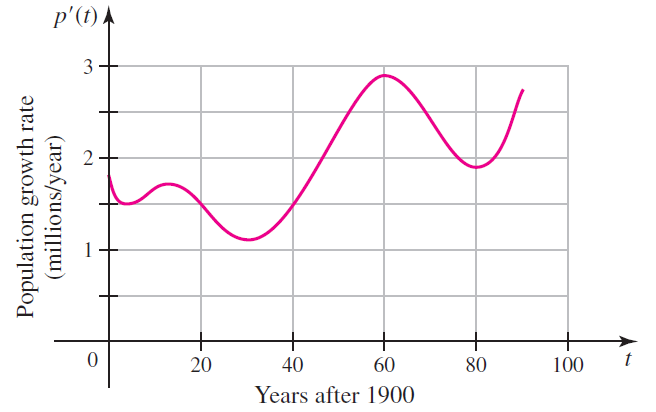
Suppose p(t) represents the population of the United States (in millions) t years after the year 1900. The graph of the growth rate p' is shown in the figure.
a. Approximately when (in what year) was the U.S. population growing most slowly between 1900 to 1990? Estimate the growth rate in that year.
b. Approximately when (in what year) was the U.S. population growing most rapidly between 1900 and 1990? Estimate the growth rate in that year.
c. In what years, if any, was p decreasing?
d. In what years was the population growth rate increasing?
Fantastic news! We've Found the answer you've been seeking!
Step by Step Answer:
a Because the graph represents the growth rate the slowest rate of about 11 million people ...View the full answer

Answered By
Muhammad Haroon
More than 3 years experience in teaching undergraduate and graduate level courses which includes Object Oriented Programming, Data Structures, Algorithms, Database Systems, Theory of Automata, Theory of Computation, Database Administration, Web Technologies etc.
3+ Reviews
10+ Question Solved
Related Book For 

Calculus Early Transcendentals
ISBN: 978-0321947345
2nd edition
Authors: William L. Briggs, Lyle Cochran, Bernard Gillett
Question Posted:
