

The graph shows the position s = f(t) of a car t hours after 5:00 p.m. relative
Question:
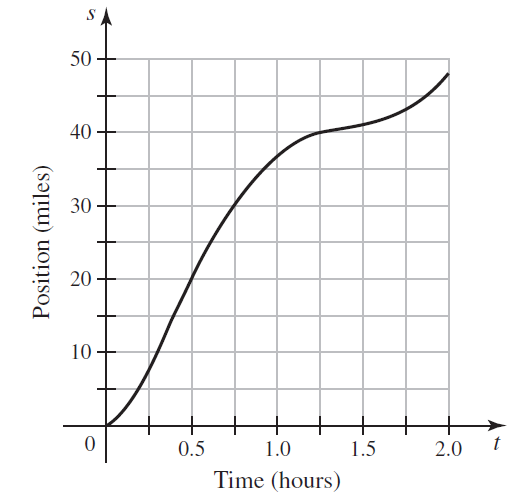
The graph shows the position s = f(t) of a car t hours after 5:00 p.m. relative to its starting point s = 0, where s is measured in miles.
a. Describe the velocity of the car. Specifically, when is it speeding up and when is it slowing down?
b. At approximately what time is the car traveling the fastest? The slowest?
c. What is the approximate maximum velocity of the car? The approximate minimum velocity?
Fantastic news! We've Found the answer you've been seeking!
Step by Step Answer:
a The slope of the curve which is the velocity increases until about 530 pm so the car is spe...View the full answer

Answered By
Benard Ndini Mwendwa
I am a graduate from Kenya. I managed to score one of the highest levels in my BS. I have experience in academic writing since I have been working as a freelancer in most of my time. I am willing to help other students attain better grades in their academic portfolio. Thank you.
107+ Reviews
240+ Question Solved
Related Book For 

Calculus Early Transcendentals
ISBN: 978-0321947345
2nd edition
Authors: William L. Briggs, Lyle Cochran, Bernard Gillett
Question Posted:
