

Table 1.5 shows the gross revenue for the Broadway season in millions of dollars for several years.
Question:
Table 1.5 shows the gross revenue for the Broadway season in millions of dollars for several years.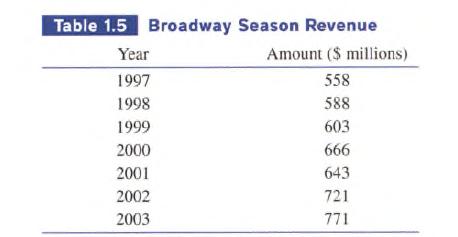
(a) Find the quadratic regression for the data in Table 1.5. Let x = 0 represent 1990, x = 1 represent 1991, and so forth.
(b) Superimpose the graph of the quadratic regression equation on a scatter plot of the data.
(c) Use the quadratic regression to predict the amount of revenue in 2008.
(d) Now find the linear regression for the data and use it to predict the amount of revenue in 2008.
Fantastic news! We've Found the answer you've been seeking!
Step by Step Answer:
a To find the quadratic regression for the data in Table 15 we can use a leastsquares regression ana...View the full answer

Answered By
Ernie Moises Evora
I have worked as a teacher, a tutor and instructor.
I have also worked as a community leader in my community.
0 Reviews
10+ Question Solved
Related Book For 
Calculus Graphical, Numerical, Algebraic
ISBN: 9780132014083
3rd Edition
Authors: Ross L. Finney, Franklin D. Demana, Bert K. Waits, Daniel Kennedy
Question Posted:
