

A research group studied the effect of a large injection of glucose in sheep fed a normal
Question:
A research group studied the effect of a large injection of glucose in sheep fed a normal diet compared with sheep that were fasting. A graph of the plasma insulin levels (in pM—pico molars, or 10-12 of a molar) for both groups is shown below. The red graph designates the fasting sheep and the green graph the sheep fed a normal diet. The researchers compared the area under the curves for the two groups.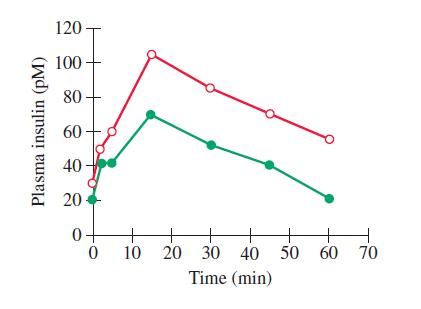
(a) For the fasting sheep, estimate the area under the curve using rectangles, first by using the left endpoints, then the right endpoints, and then averaging the two. Note that the width of the rectangles will vary.
(b) Repeat part (a) for the sheep fed a normal diet.
(c) How much higher is the area under the curve for the fasting sheep compared with the normal sheep?
Step by Step Answer:
Since answers are found by estimating values on the graph exact answers may vary slightly however wh...View the full answer


