

The accompanying graph shows the consumption of the baby boom generation, measured as a percentage of total
Question:
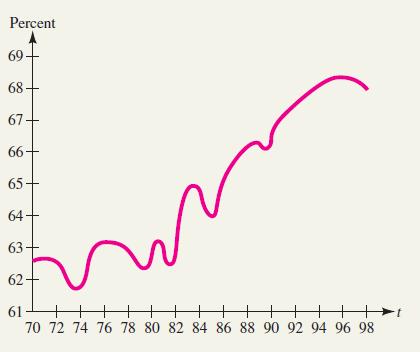
The accompanying graph shows the consumption of the baby boom generation, measured as a percentage of total GDP (gross domestic product) during the time period 1970–1997.
a. At what years do relative maxima occur?
b. At what years do relative minima occur?
c. At roughly what rate was consumption increasing in 1987?
d. At roughly what rate was consumption decreasing in 1972?
Fantastic news! We've Found the answer you've been seeking!
Step by Step Answer:
a Approximately 1971 1976 19...View the full answer

Answered By
Danish Sohail
My objective is to become most reliable expert for clients. For last 10 years I have been associated with the field of accounting and finance. My aim is to strive for best results and pay particular attention to client needs. I am always enthusiastic to help clients for issues and concerns related to business studies. I can work on analysis of the financial statements, calculate different ratios and analysis of ratios. I can critically evaluate stock prices based on the financial analysis and valuation for companies using financial statements of the business entity being valued with use of excel tools. I have expertise to provide effective and reliable help for projects in corporate finance, equity investments, financial accounting, cost accounting, financial planning, business plans, marketing plans, performance measurement, budgeting, economic research, risk assessment, risk management, derivatives, fixed income investments, taxation, auditing, and financial performance analysis.
78+ Reviews
112+ Question Solved
Related Book For 

Calculus For Business, Economics And The Social And Life Sciences
ISBN: 9780073532387
11th Brief Edition
Authors: Laurence Hoffmann, Gerald Bradley, David Sobecki, Michael Price
Question Posted:
