

The following table gives the historic and projected populations (in millions) of China and India. Use a
Question:
The following table gives the historic and projected populations (in millions) of China and India.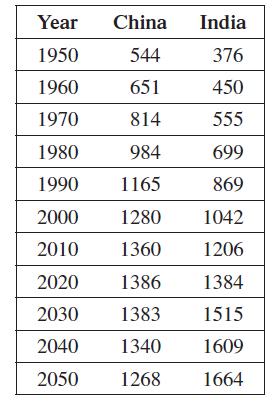
Use a calculator with logistic regression capability to do the following.
(a) Letting t represent the years since 1950, plot the Chinese population on the y-axis against the year on the t-axis. Discuss the appropriateness of fitting a logistic function to these data.
(b) Use the logistic regression function on your calculator to determine the logistic equation that best fits the data. Plot the logistic function on the same graph as the data points. Discuss how well the logistic function fits the data.
(c) Assuming the logistic equation found in part (b) continues to be accurate, what seems to be the limiting size of the Chinese population?
(d) Repeat parts (a)–(c) using the population for India.
Step by Step Answer:
a b c According to the model the limi...View the full answer


