

The following table shows the amount of crude oil (in billions of barrels) produced in the United
Question:
The following table shows the amount of crude oil (in billions of barrels) produced in the United States in recent years.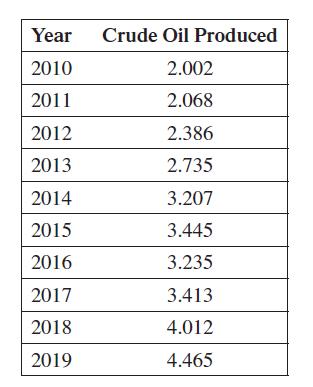
In this exercise we are interested in the total amount of crude oil produced over the 9-year period from mid-2010 to mid-2019, using the data for the 10 years above.
(a) One approach is to sum up the numbers in the second column, but count only half of the first and last numbers. Give the answer to this calculation.
(b) Approximate the amount of crude oil produced over the 9-year period 2010–2019 by taking the average of the left endpoint sum and the right endpoint sum. Explain why this is equivalent to the calculation done in part (a).
(c) Find the equation of the least squares line for this data, letting t = 0 correspond to 2000. Then integrate this equation over the interval 310, 194 to estimate the amount of crude oil produced over this time period. Compare with your answer to part (a).
Step by Step Answer:
a The estimate is 277345 billion barrels b The left endpoint sum is 2650...View the full answer


