

The National Highway Traffic Safety Administration records the time of day of fatal crashes. The table on
Question:
The National Highway Traffic Safety Administration records the time of day of fatal crashes. The table on the next page gives the time of day (in hours since midnight) and the frequency of fatal crashes in 2018.
(a) Plot the data using the midpoint and the frequency. What type of function appears to best match these data?
(b) Use the regression feature on your graphing calculator to find a cubic equation that models the time of day, t, and the number of traffic fatalities, T(t). Use the midpoint value to estimate the time in each interval. Graph the function with the plot of the data. Does the graph fit the data?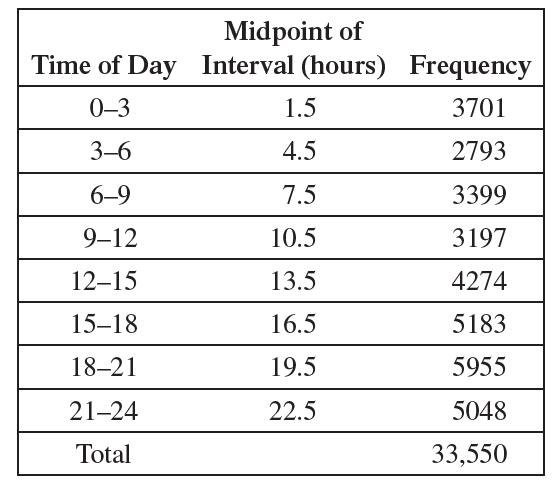
(c) By finding an appropriate constant k, find a function S(t) = kT(t) that is a probability density function describing the probability of a traffic fatality at a particular time of day.
(d) For a randomly chosen traffic fatality, find the probabilities that the accident occurred between 12 a.m. and 2 a.m. (t = 0 to t = 2) and between 4 p.m. and 5:30 p.m. (t = 16 to t = 17.5).
Step by Step Answer:
a A polynomial function could fit the da...View the full answer


