

The number of litres of milk consumed in a group of 160 houses per week are shown
Question:
The number of litres of milk consumed in a group of 160 houses per week are shown in the table.
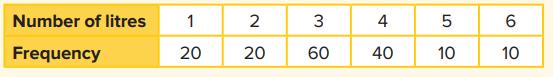
a. Calculate the fraction of the total for each number of litres consumed.
b. Draw a pie chart to represent this data.
c. Draw a waffle diagram with 32 squares to represent this data.
Fantastic news! We've Found the answer you've been seeking!
Step by Step Answer:
To calculate the fraction of the total for each number of liters consumed and draw a pie chart and a ...View the full answer

Answered By
Diana Muriuki
As an online math tutor, I have several years of hands-on experience working with students of all ages and skill levels. I hold a Bachelor's degree in Mathematics and a Master's degree in Education. Additionally, I have completed multiple training courses in online teaching and tutoring methods.
Throughout my career, I have worked with students in both individual and group settings, including classroom teaching, after-school tutoring, and online instruction. I am proficient in teaching a wide range of math topics, from basic arithmetic to advanced calculus and statistics.
One of my greatest strengths as a tutor is my ability to adapt my teaching style to meet the unique needs and learning styles of each individual student. I understand that every student is different, and I strive to create a comfortable and supportive learning environment that encourages growth and development.
In addition to my formal education and tutoring experience, I am also a lifelong learner with a passion for mathematics. I am constantly seeking out new resources and methods to improve my own knowledge and skills, and I believe this passion and enthusiasm helps to inspire my students as well.
Overall, my hands-on experience and proficiency as a math tutor are grounded in a combination of formal education, practical experience, and a genuine love of mathematics. I am confident in my ability to help students achieve their goals and succeed in math, and I look forward to the opportunity to work with new students and continue to grow as an educator.
0 Reviews
10+ Question Solved
Related Book For 
Cambridge Checkpoint Lower Secondary Mathematics Student's Book 7
ISBN: 9781398301948
3rd Edition
Authors: Frankie Pimentel, Ric Pimentel, Terry Wall
Question Posted:
